
Asset allocation is important to every investor because it helps them identify how to produce the returns they need based on the risk level they can tolerate. The three most common asset classes that advisors use are cash, fixed income, and equities. Each of these asset classes generate different returns and offer different levels of risk. By varying the percentages held in these asset classes, a portfolio can be built to match an investor’s risk level and help target a rate of return.
One of the problems with asset allocation is that it requires educating the client on a complex topic and any confusion could stall the financial planning process. One way to simplify the discussion about investments, and keep the process moving along, is to reduce the conversation to two topics: Rate of Return and Tax Efficiency.
For investments that are not in programs such as RRSPs and TFSAs, asset allocation not only generates a rate of return, it also has a direct impact on the taxation of the portfolio. Each asset class can generate income though interest, dividends, or capital gains and will provide a different level of taxation. The level of tax (Tax Efficiency) within a portfolio will be a key factor in its performance.
Tax Efficiency is used by RazorPlan to allow an advisor to model the impact of taxes and asset allocation without complex data entry.
The percentage of income earned in a portfolio that is not subject to tax is called the Tax Efficiency factor (TE Factor) of the portfolio. For each type of investment income earned, this factor varies. As the table below shows, interest income is the least efficient type of investment income because it is fully taxable when received, meaning it has zero tax efficiency.
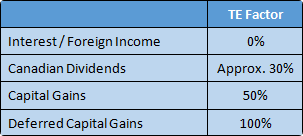
Dividends and capital gains receive preferential tax treatment and therefore have higher TE factors. For dividends, the TE Factor also depends on the province of residence, but typically the TE Factor is around 30%. By analyzing asset allocation, advisors can determine a Tax Efficiency assumption to use in their investment projections.
Allocation Example
Based on a rate of return for cash of 2%, fixed income of 4%, and equity of 7%, each of the following five asset allocations will have the same rate of return but produce different Tax Efficiencies. The TE factors applied to these asset classes will be the same as those mentioned in the above table.
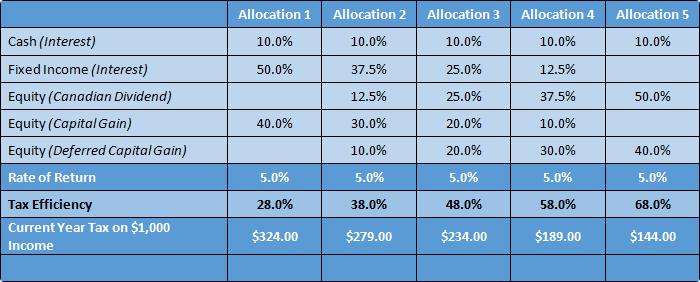
Assuming a 46.41% marginal tax rate (Ontario), the table above shows the impact Tax Efficiency has on $1,000 of investment income. Allocation 1 and Allocation 5 both produce a 5% return but Allocation 5 is 40% more tax efficient, resulting in $180 less taxes for every $1,000 of income. By simply using rate of return and Tax Efficiency, advisors can reconstruct any one of these portfolios within RazorPlan with minimal effort.
The benefit of using Tax Efficiency is that it simplifies a very complex topic for your clients. Instead of talking about sector rotation, efficient frontiers, risk tolerance, simulation analysis, and asset allocation, you can focus on a return and how that return is going to be taxed. By simplifying the portfolio conversation, the clients understand the topic better and are more likely to act on any recommendations.
By incorporating tax efficiency into RazorPlan, advisors are able to minimize the complexity of a financial analysis but maintain accurate tax calculations. The end result is a more efficient process.
Calculator
To assist in calculating the Tax Efficiency of a client’s portfolio, the following calculator has been made available.
Need more help with this?
Contact Razor Support