

After entering client data, the Chart Screen displays the calculated analysis and allows you to begin working with the client file.
There are two areas included in the Chart Screen; the Charts Panel and the Data Panel.
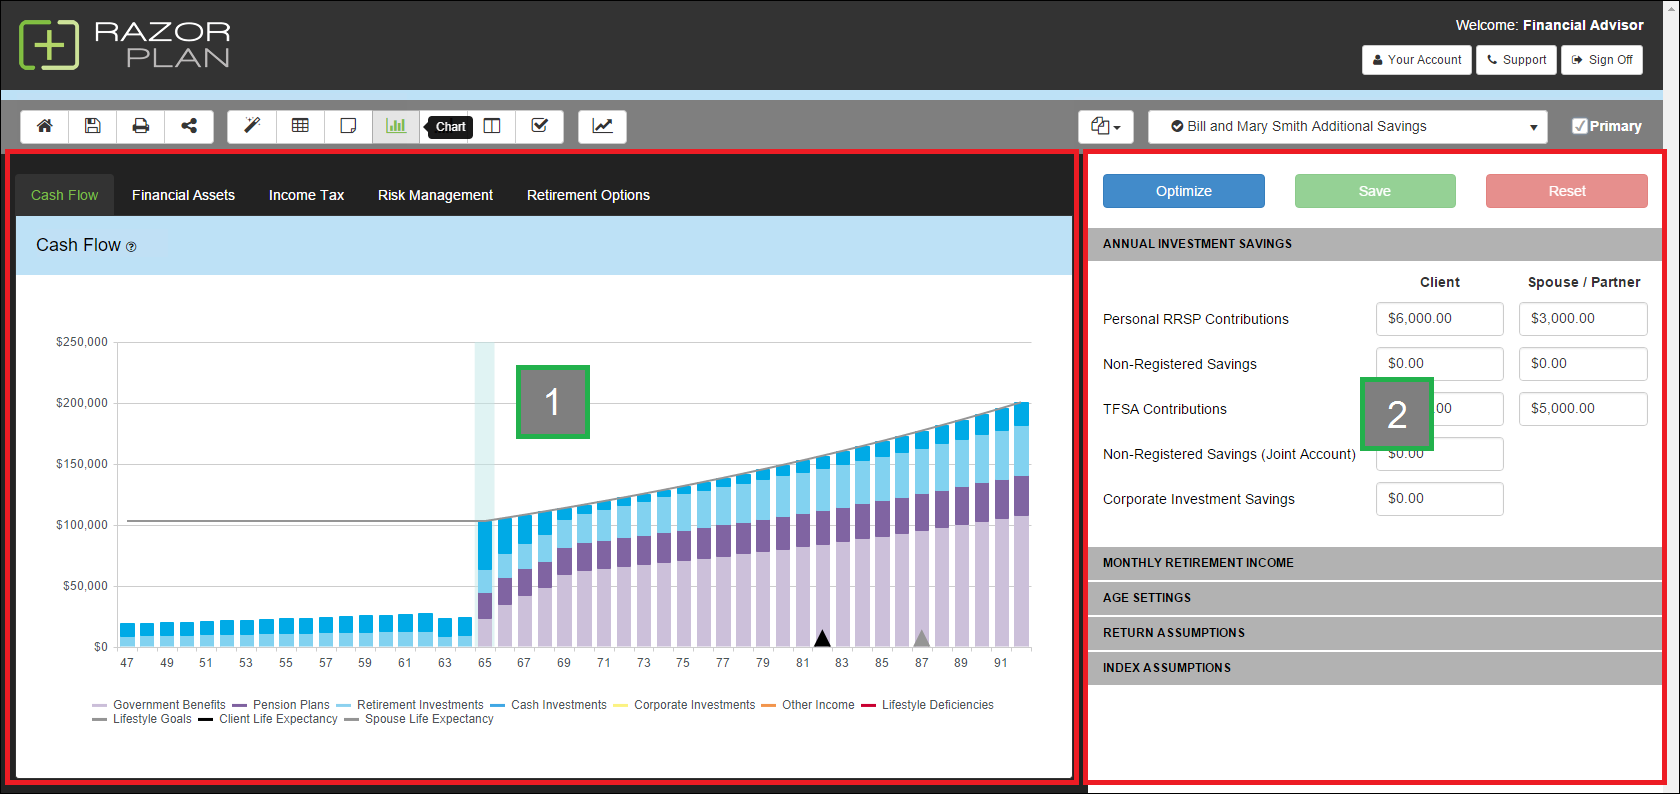
1. Charts Panel
The Chart Panel contains 5 charts; Cash Flow, Financial Assets, Income Tax, Risk Management and Retirement Options. These charts act as the on-screen display of the client analysis. Client meetings can be run using the Chart Screen for an on-the-fly discussion, or this information can be printed out through the use of the Client Report.
2. Data Panel
The Data Panel allows you to modify key client data points and solve for optimal values. This approach allows you to modify data and optimize without having to navigate back to the Data Entry Screen.
Tutorial
Need more help with this?
Contact Razor Support