
The Homogeneity Study is only available in the Appraisal File, however, user may Plot Sales on map through Statistical Analysis.
A Homogeneity Study is a study of the similarities between weighted variables.
In the appraisal world, this can be helpful in comparing similar traits of a subdivision to stratify (divide or group) into neighborhoods.
This allows user to use ANY created Comparable Selections Tables these will define what makes property comparable.
(It’s a good idea to be familiar with the Comparable Selections Table before proceeding.)
Example of a Homogeneity Study in the Appraisal File
CREATE an Index
In this example the Index is for the subdivisions in the North half of a city.
GO TO: Tools — GIS Tools — Homogeneity Study
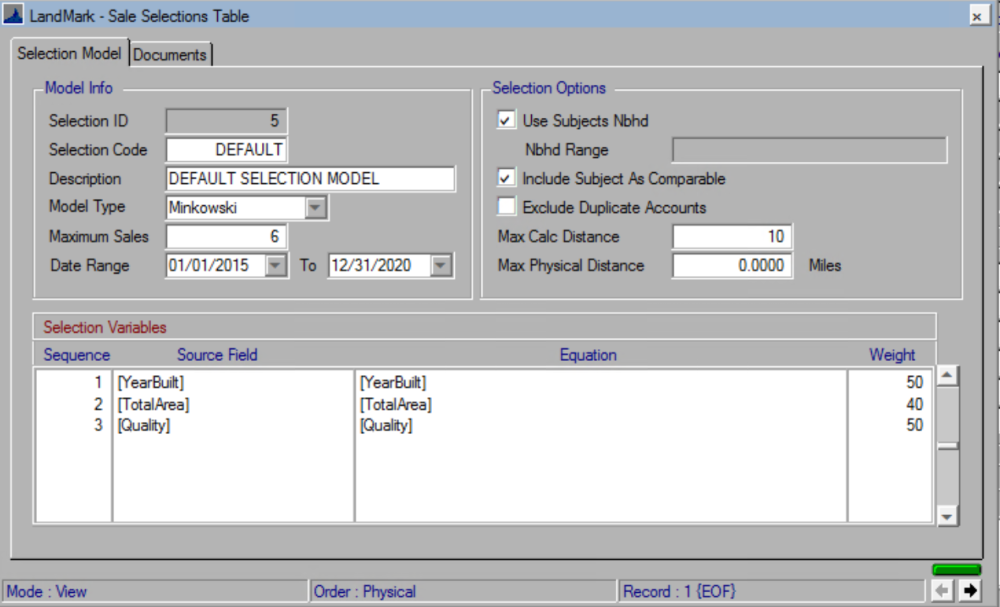
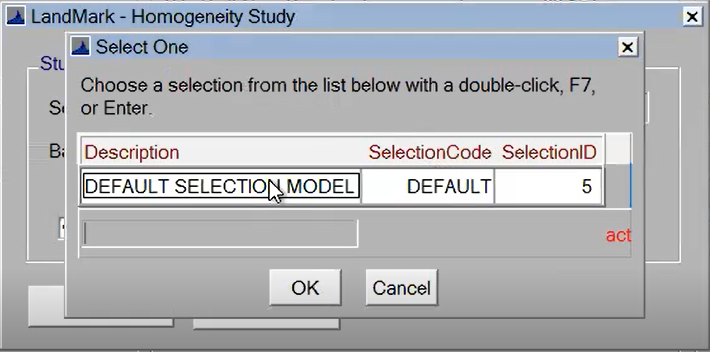
SELECT which Comparable Selections Table to use
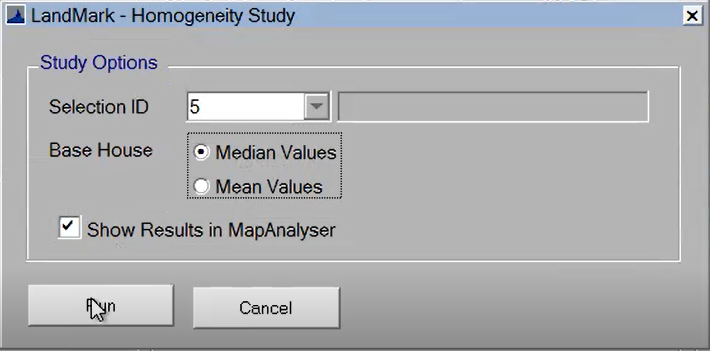
SELECT Median Values or Mean Values
Median Values will show (middle)
Mean Values (average)
CHECK Show Results in MapAnalyzer
RUN
How does is calculate the results?
- First it will calculate the base values, the average house in that neighborhood. (The typical house in this group of houses.)
- Then it will calculate the distance metric (not physical distance), how far the other properties deviates from the typical/average house.
From these calculations it will build a spreadsheet and a map.

This will not tell you how to group properties. It will tell you how NOT similar they are.

User may CHOOSE a property, RIGHT-CLICK to view attributes of the individual and assess WHY the distance from the typical.

The Homogeneity Study came out around 9.2.2022 please see the updates page to view the video starting at point 15:44
Post your comment on this topic.