
This allows the user to take any of the attributes of a module and project them on a map, creating a separate layer.
It’s a great tool to take data from LandMark to a visual in MapAnalyzer. The possibilities are endless.
Tip: Sometimes expanding the area, gives user a better picture of the trends.
Check out a quick overview video 9.19.22 on this starting at 6:19.
BUILD an Index
CLICK Tools — GIS Tools — Create Layer From Index
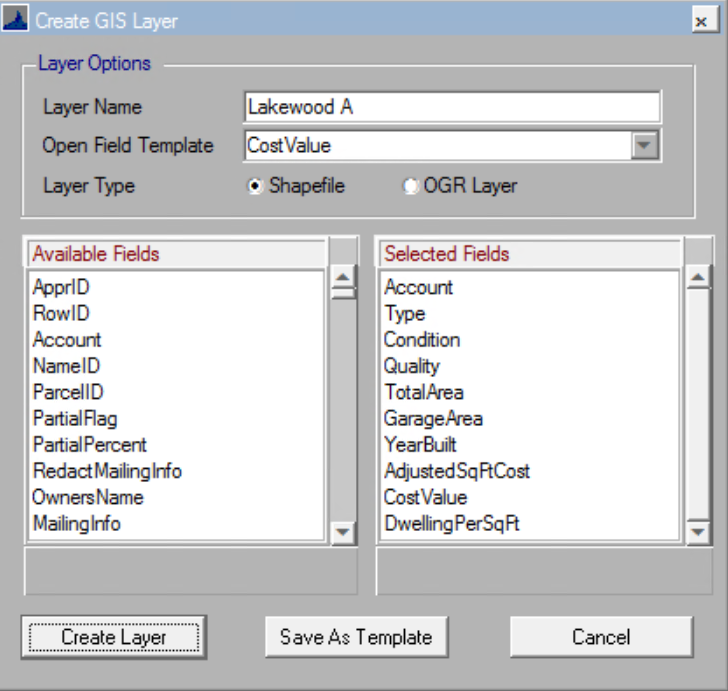
The Create GIS Layer box will open.
NAME the layer
CHOOSE by double-clicking Selected Fields (attributes) you want available in the layer
OR
CHOOSE a saved template (down-arrow) in the Open Field Template
(Build and Save any (module specific) attributes or selection fields you want to save as a template, available for use in other layers, CHOOSE Save As Template.)
CLICK Create Layer
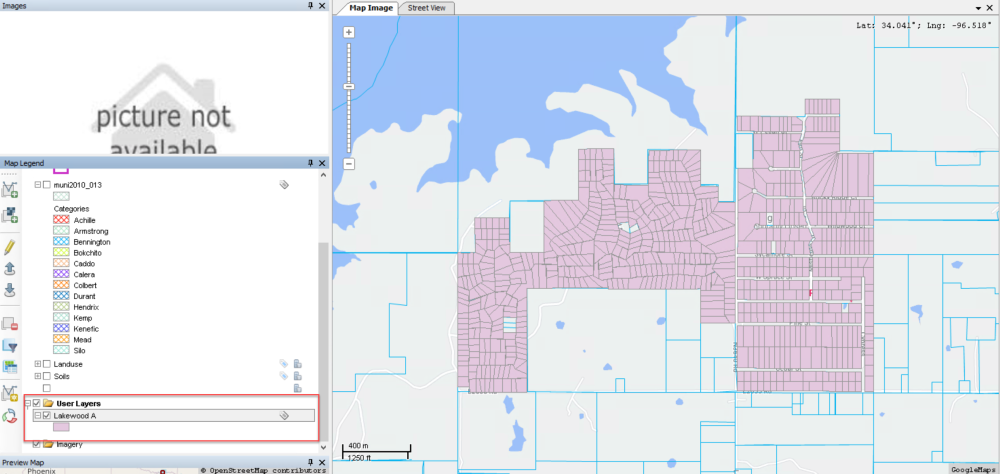
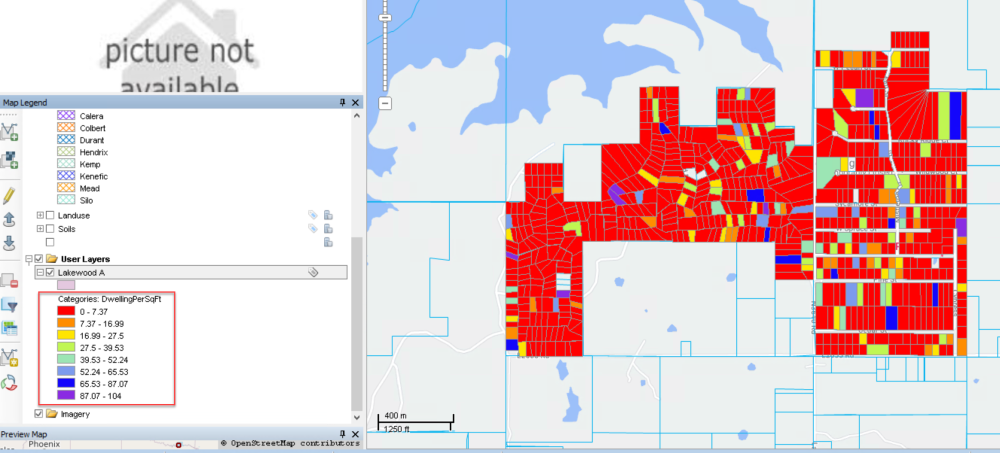
The map will open with index in a different color.
Notice the new layer in the Map Legend under User Layers.
Note: This is an ‘in memory layer’ until the user saves the map state.
If user saves the layer and then decides to remove, RIGHT-CLICK on layer and CHOOSE Remove Layer.
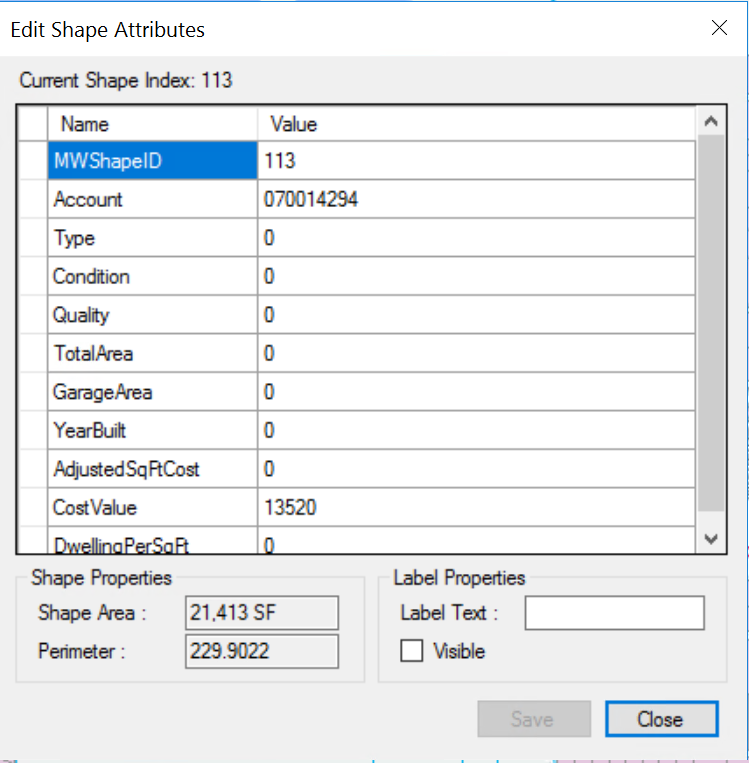
RIGHT-CLICK on the map and view Attributes to see the same selected fields-chosen for this layer.
To categorize the layer.
RIGHT-CLICK on layer
CHOOSE Properties
The layer properties box will open.
CLICK on the Categories tab.
CHOOSE (highlight) the field to project on the map.
CHOOSE a Color Scheme to correspond to the changing values.
CLICK Generate and Apply
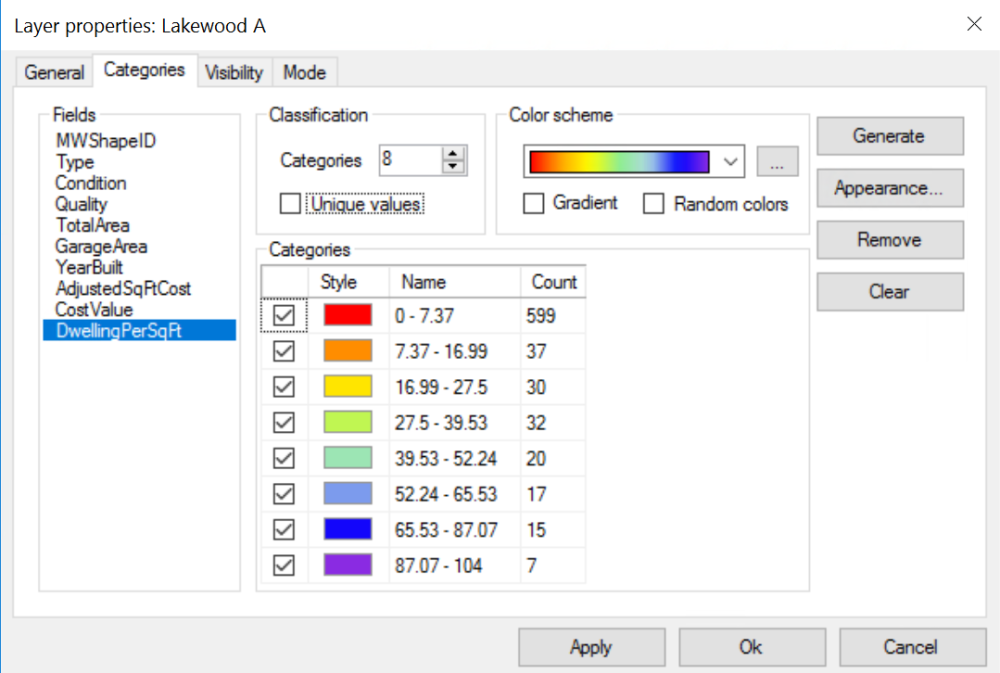
In this example, you can see the difference in values at a glance.
Post your comment on this topic.