
The purpose of this section is to illustrate how to generate, and view a Product Mix Report.
Product Mix Report
STEP 1: From your Dashboard view, mouse over the Reports tab and click Sales Reports.
*Hint: You can also access Sales Reports by clicking on the Reports tab and then on Sales Reports.
STEP 2: From the Sales Reports screen, click Product Mix.
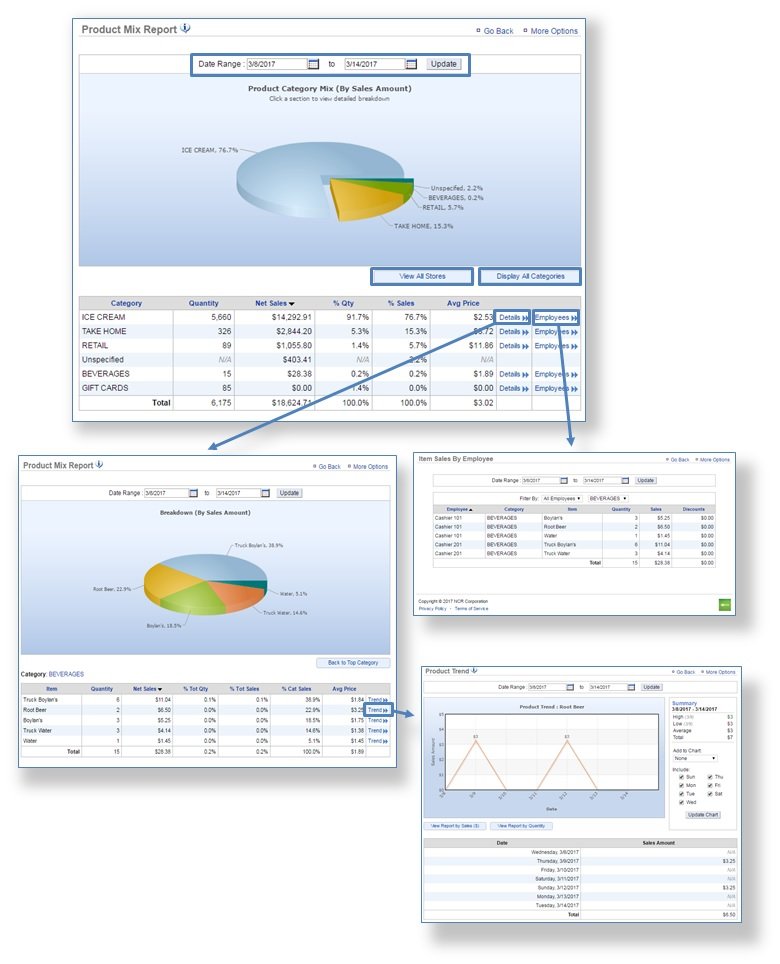
STEP 3: The Product Mix Report will provide you with sales information related to product for the date range you set. To select a date range, enter your preferred date range at the top of the page and click Update.
- Click Details at the bottom right of the chart details section to view sales information for items within a specified category. Within this view, click Trend to the right of any category item to see the purchasing trend for the date range you set. See STEP 3 for more detailed information.
- Click Employees, to view your item sales for that category by your employees.
![]()
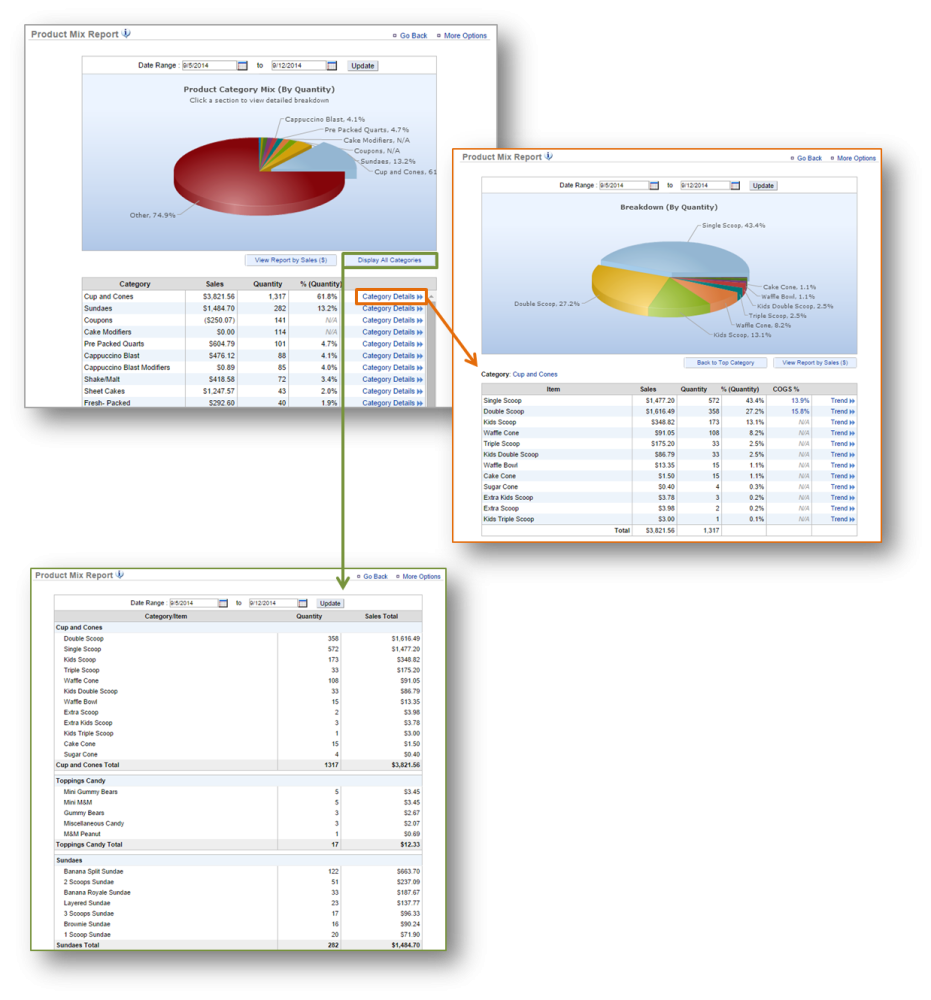
STEP 4: To view your product mix report by quantity of items sold, click View Report by Quantity.
- Click Category Details at the bottom right of the chart details section to view sales information by quantity for items within a specified category.
- Click Display All Categories at the bottom right of your chart to view product mix detail as a list. This report will show quantity and sales for all categories and items pertaining to each category within the date range you set.
![]()
Related Topics
Sales Reports
Inventory Reports
Labor Reports
Training Reports
Survey Reports