
The purpose of this section is to showcase the Cost of Goods Sold Report category.
Cost of Goods Sold Report
STEP 1: From your Dashboard view, mouse over the Reports tab and click Inventory.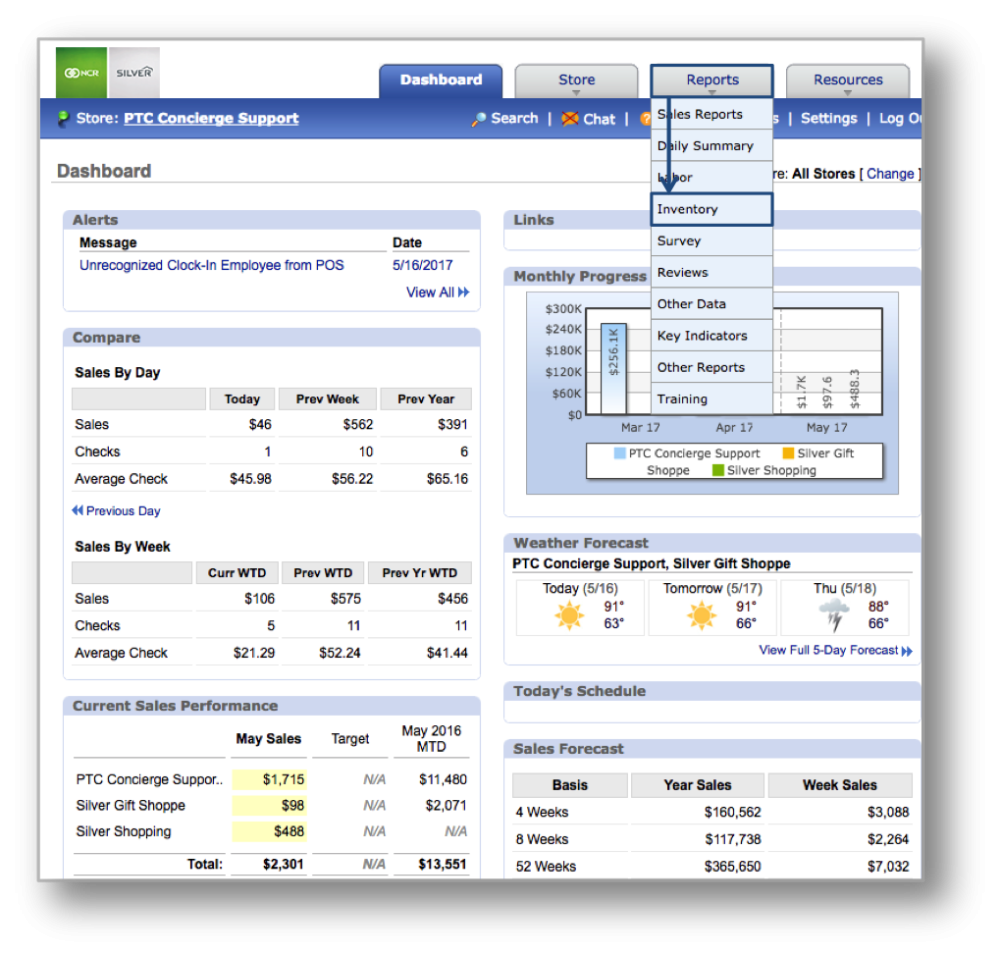
*Hint: You can also access the Inventory by clicking on the Reports tab and then on Inventory.
STEP 2: From the Inventory Reports screen, click Cost of Goods Sold.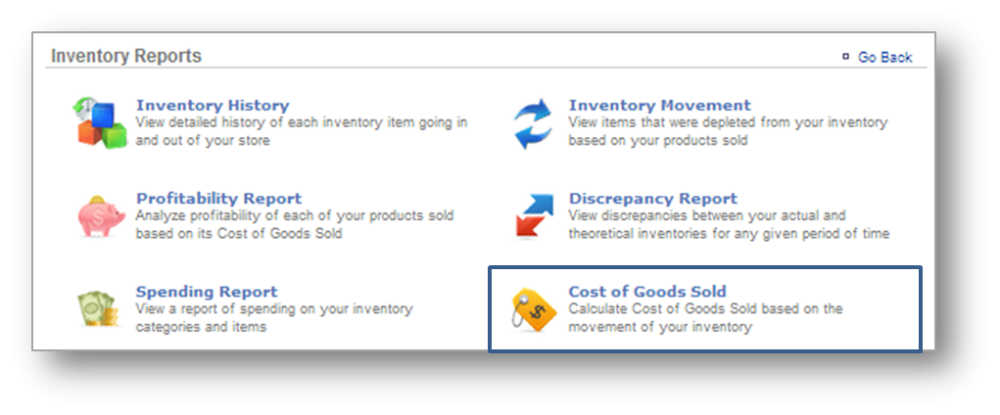
STEP 3: The Cost of Goods Sold Report will provide you with your total cost of goods sold for the date range you set. To select a date range, enter your preferred date range at the top of the page and click Update. 
Your report will be grouped by category and will reflect:
- Each inventory item name.
- The unit of measurement for each item.
- Beginning Inventory (your beginning inventory for the date range you set).
- Received Inventory (inventory received for the date range you set).
- Ending Inventory (your ending inventory as of the date range you set).
- Used Inventory (the amount of inventory used over the course of the date range you set).
- Used Cost (the cost of each inventory item multiplied by the amount that was used).
- Cost to Sales (the percentage of inventory items against total sales for the date range you set).
- Cost to Category Sales (the percentage of inventory items against total category sales for the date range you set).
Related Topics
Inventory History
Profitability Report
Spending Report
Inventory Movement
Discrepancy Report