
Overview
Kramer Control version 2.2 provides Dashboard users with more customization ability. One of these options is to Add charts to your Dashboard information screen. Follow the steps below to Add a New chart today!
Process
- Open Dashboard
- Select the Project from the left pane
- (Optional) Select the Space from within the Project
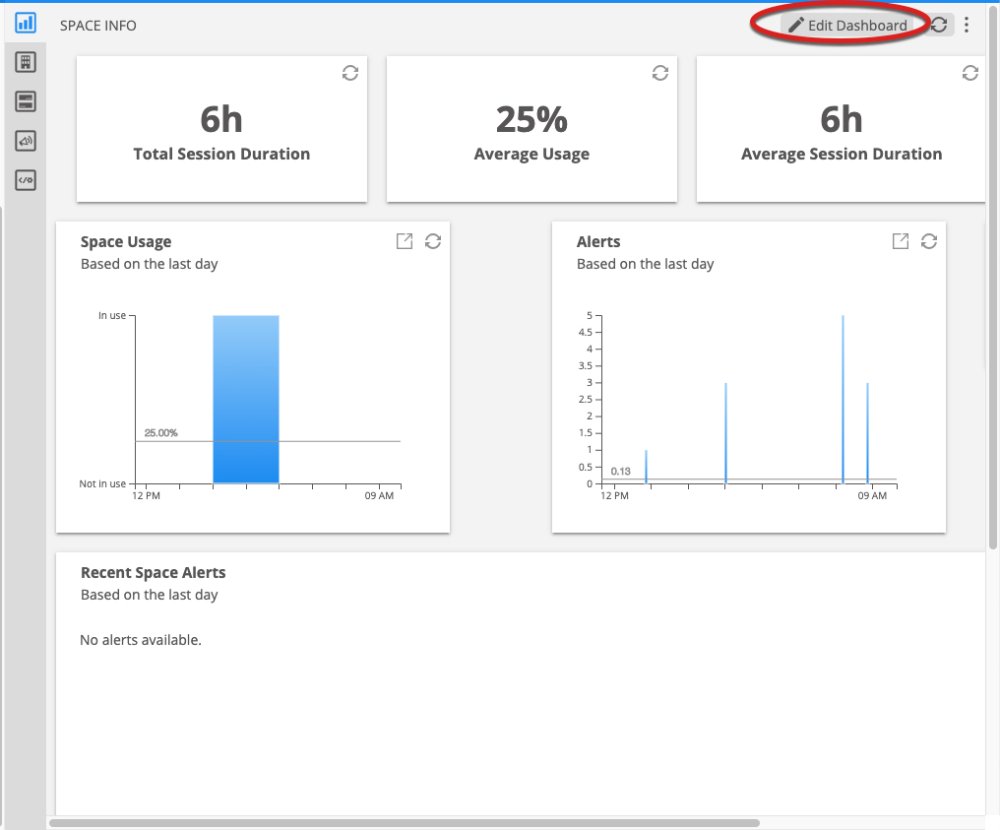
Choose the Option atop right your screen to Edit Dashboard
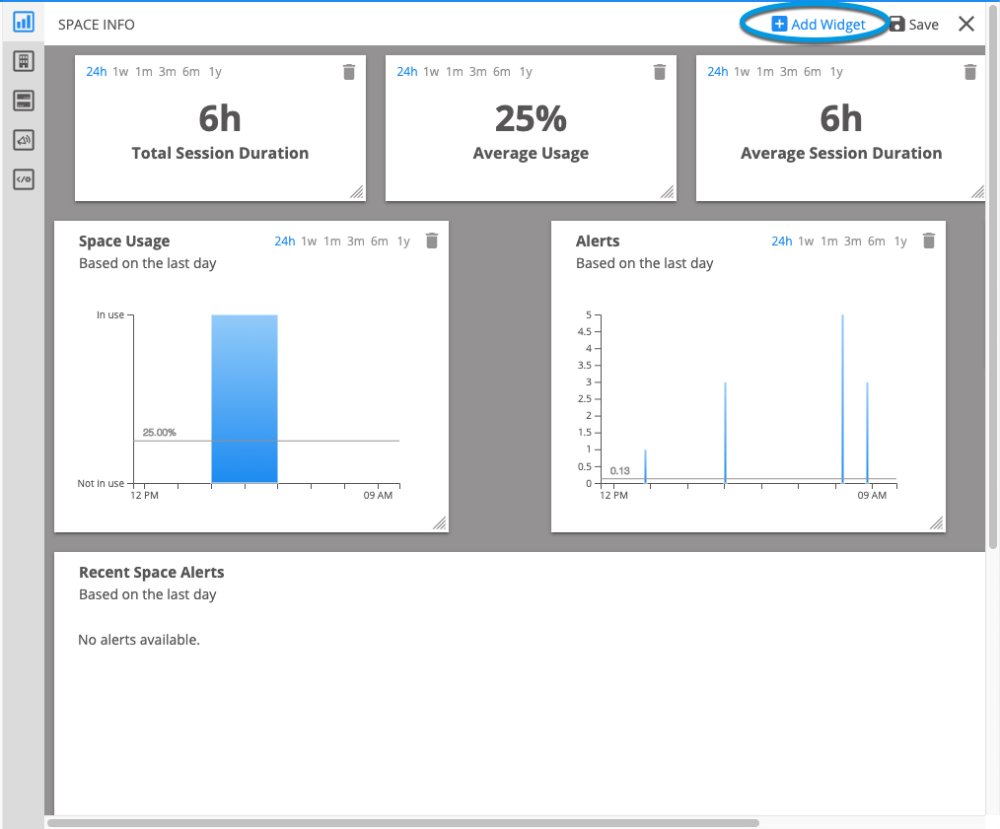
Select the Add Widget option that now appears
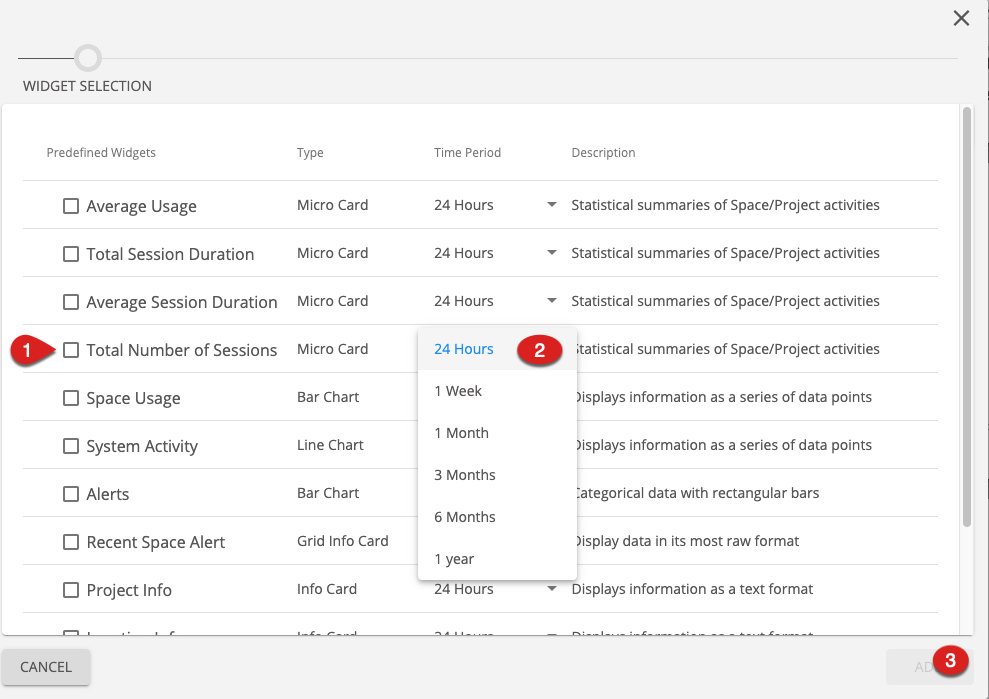
Within the new popup select a predefined widget and the time period you would like to track, then Save your selections
Revision:
1
Last modified:
6 June 2019
Feedback
Copyright © 2025 Kramer
—
Powered by 
Post your comment on this topic.