Dashboard
Introduction:
A dashboard is a panel where we can insert the most important items and information that we want to monitor.
There are 3 types of dashboards, they are:
Corporate: does not have a filled area, therefore, any user of the system can access it.
By area: has a filled area, therefore, only users who have permission in the dashboard area can access it.
Individual: each user has their own. See the topic Individual Dashboard.
Procedures:
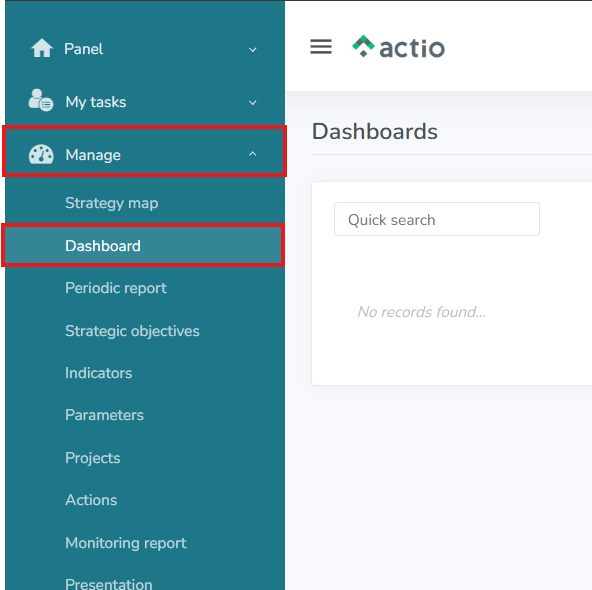
1. To register a corporate or area dashboard, access the Manage > Dashboard menu:
2. Click on the + button, the system will open a form to be filled in with the Dashboard information:
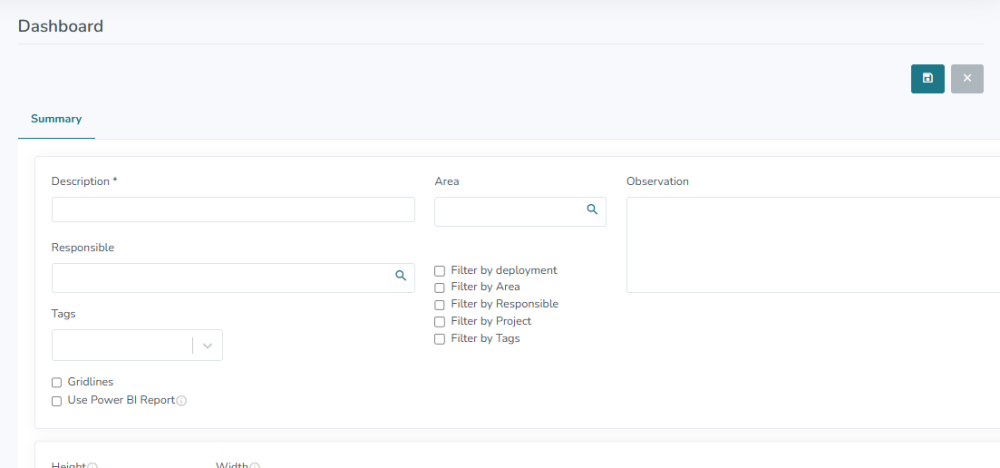
The description field is mandatory. If you want the Dashboard to be by area, fill in the area. You can assign a person in charge and add any notes if you wish.
Click on save, the Dashboard is created!
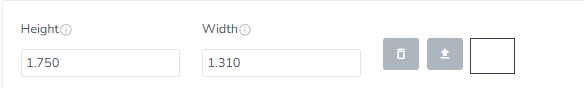
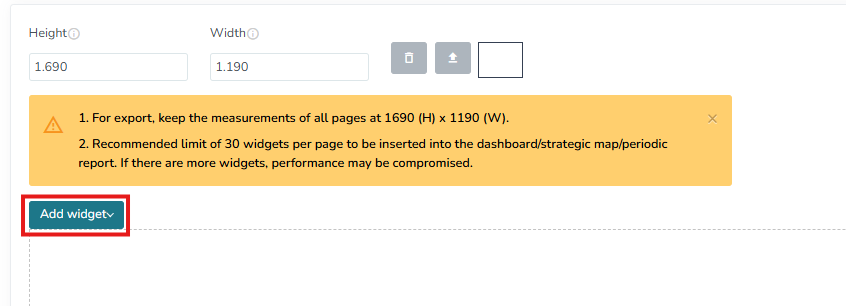
3. The first option we have is to change the size of the Dashboard, by default, it will be 1690 (H) x 1190 (W), if you are going to export this dashboard, keep these dimensions on all pages.
4. The next option is to delete and insert a background image for the Dashboard. To delete the image, click on the trash can. To insert, click on the arrow, and upload the image.
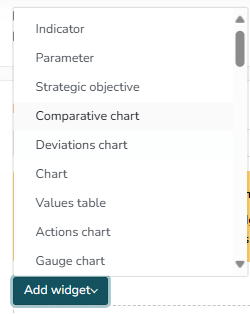
5. Now you need to insert the widgets that you want to view the information. To do this, click on the “Add widget” button and select the desired option:
6. When you click to insert a widget, the system will insert a blank box where you can enter the information. In this box, right-click > Edit:
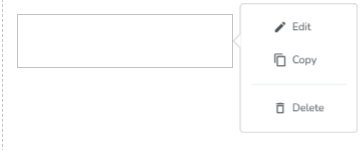
For all widgets, when you click on edit, the system will display a pop-up screen, where you can enter the desired information and settings.
NOTE: all information entered in the dashboard must have been previously registered. The dashboard will only display information that is already in the system.
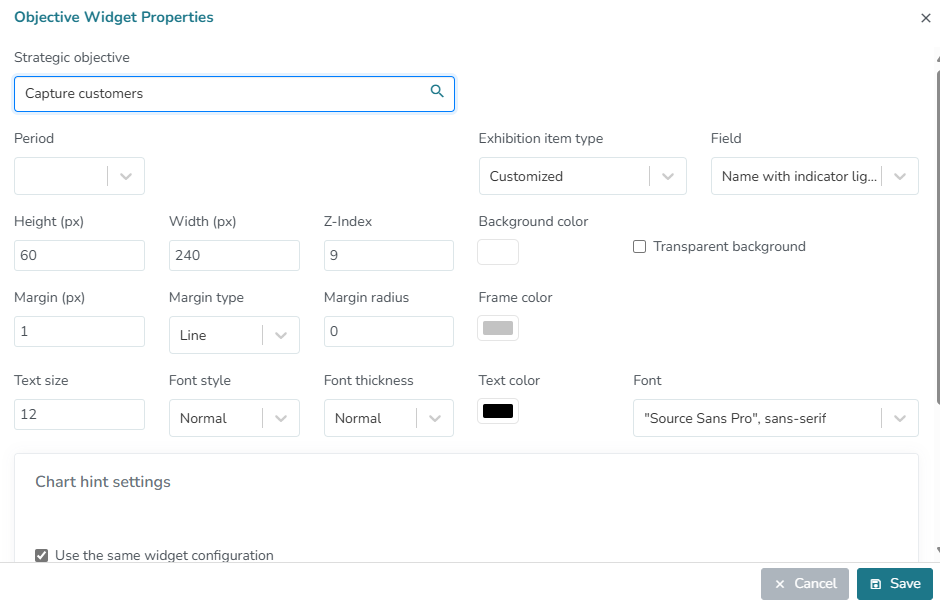
7. Indicator/Parameter/Strategic Objective Widget: shows the name of the item and the monthly and accumulated indicator. The indicator on the left refers to the indicator for the month and the indicator on the right refers to the accumulated indicator. Select an item, make the necessary settings and save:
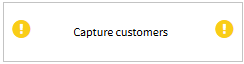
NOTE: for parameters, the system will only display the description, since parameters do not have lighthouses.
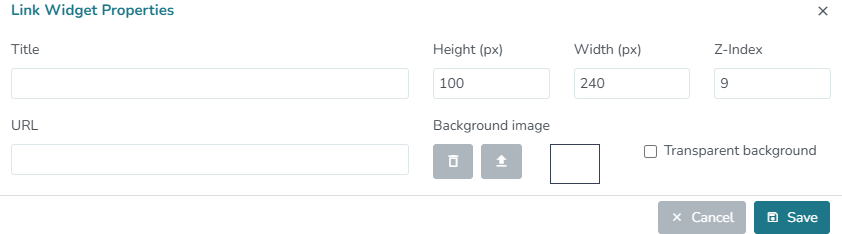
For all widgets, the system will provide the option to change the title, background color, height, width, z-index (brings the widget to the front or back of all other widgets), border color, border, border type, border radius, start date and end date, etc.
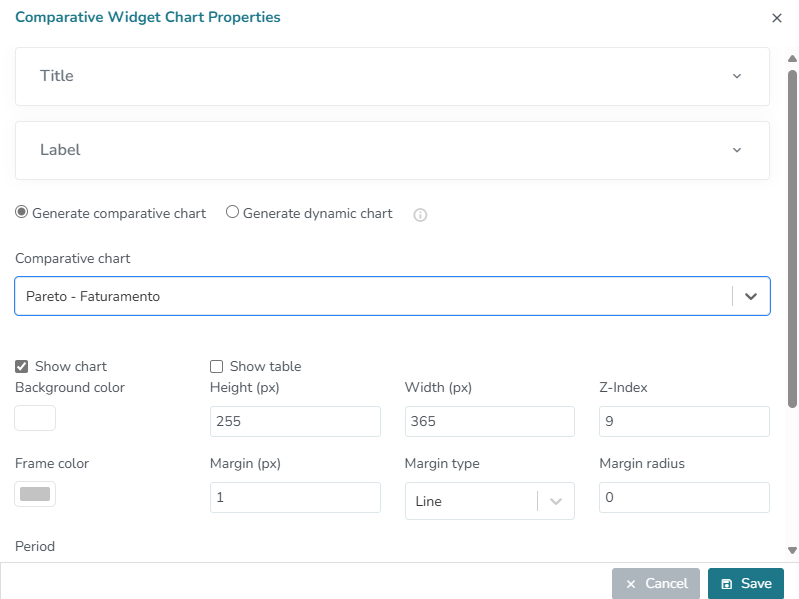
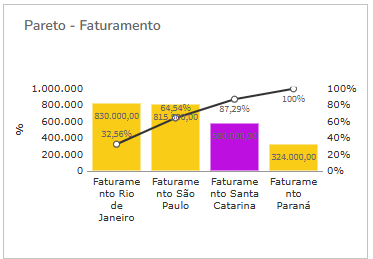
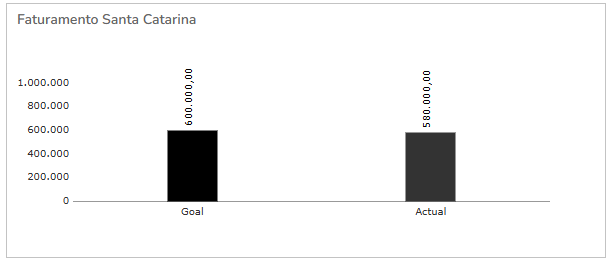
8. Comparative Chart Widget: the comparative chart compares the result between two or more indicators. When inserting a comparative chart widget, right-click > edit > and select the desired comparative chart.
9. Deviation Chart Widget: will follow the same pattern as the other widgets mentioned above. The deviation chart shows how much the indicator deviated from its target.
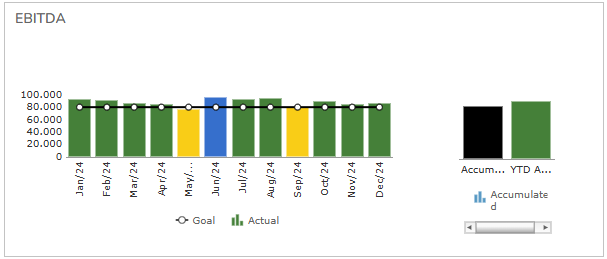
10. Chart Widget: displays the results of the item (indicator/strategic objective/parameter) in the form of a chart:
11. Stock Chart Widget: displays a chart of the actions in the form of a pie, donut or stacked columns. For this option, the filters are different from the other options mentioned, you can filter by area, by person in charge, item, etc.
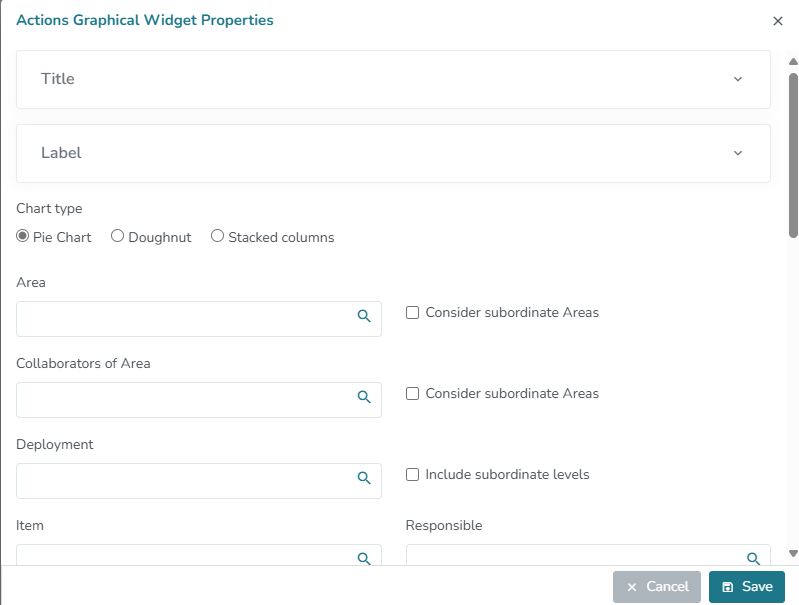
Rules:
- Displays only last-level/child/typed actions;
- Displays only source actions;
- Does not display actions in planning;
- Does not display archived actions.
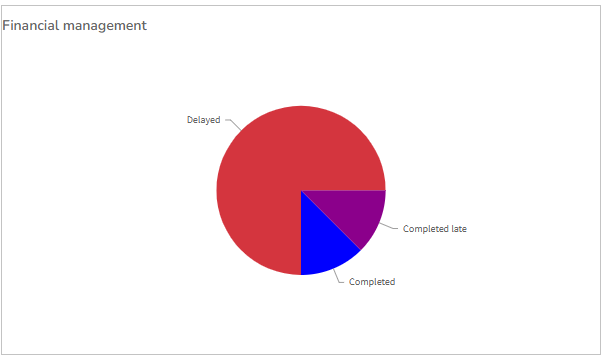
The example below is a pie chart that returns all the actions in the Financial Management area:
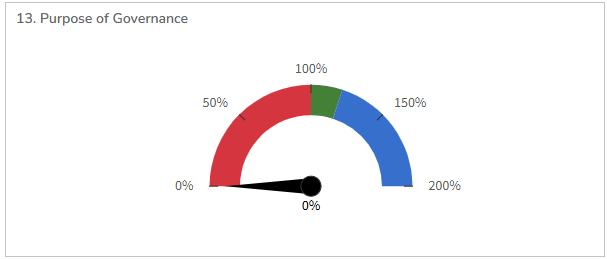
12. Gauge Chart Widget: displays the indicator’s performance in the form of a speedometer.
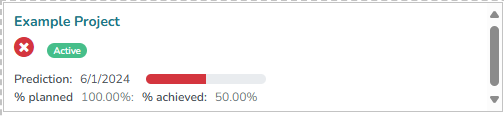
13. Project Widget: displays the main information about a given project, such as: name, forecast, status of actions (schedule), person responsible, etc. It is possible to hide some of this information:
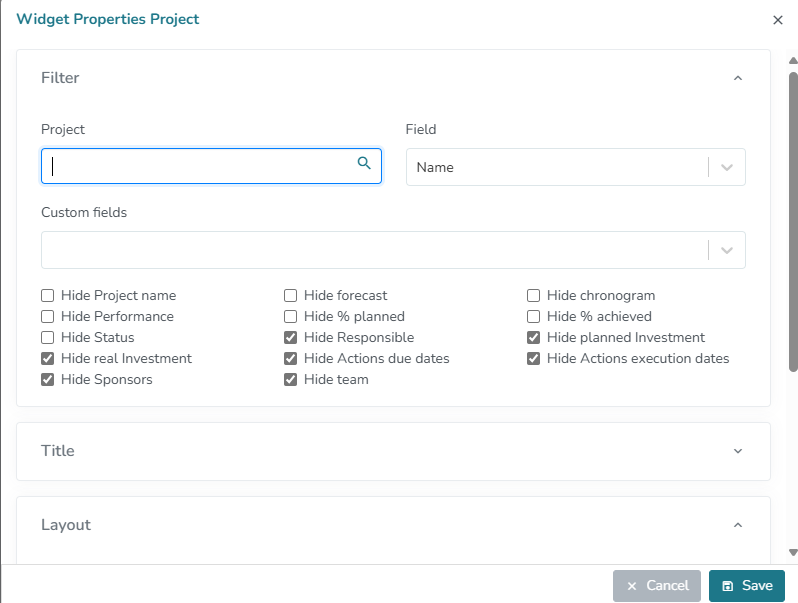
This option is interesting, as you can monitor the project’s schedule:
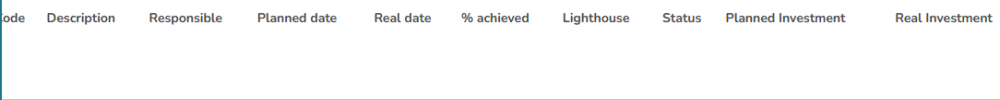
14. Action Widget: displays the main information about a given action, such as: name, expected date, date performed, person responsible, status, etc. It is possible to hide some of this information:
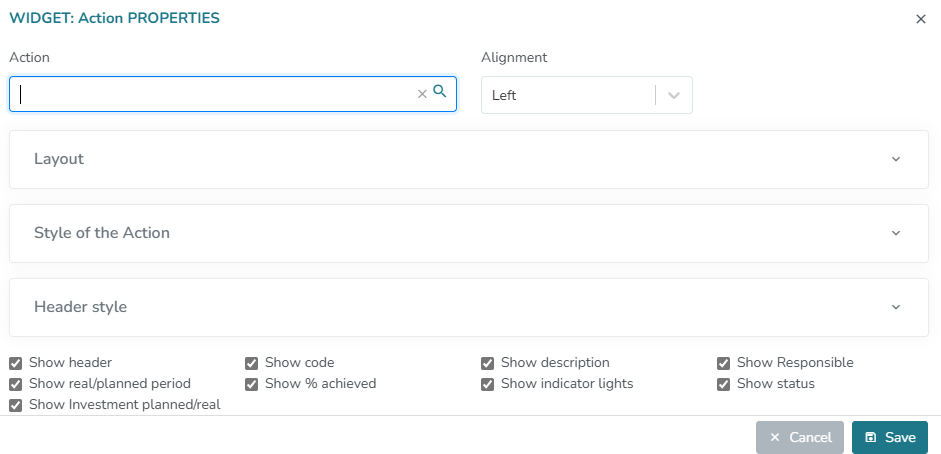
Here is an example of this widget:
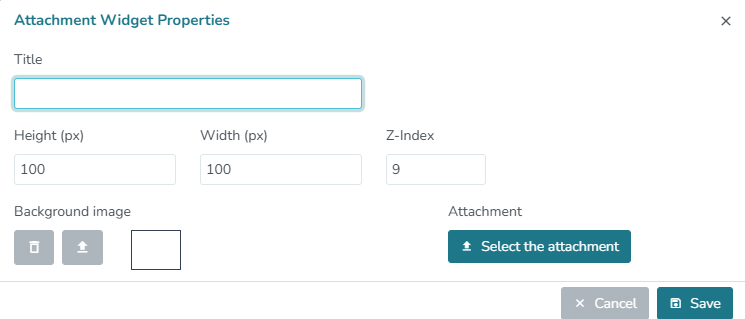
15. Attachment Widget: You can upload a file and when you view the dashboard, you will be able to download this file.
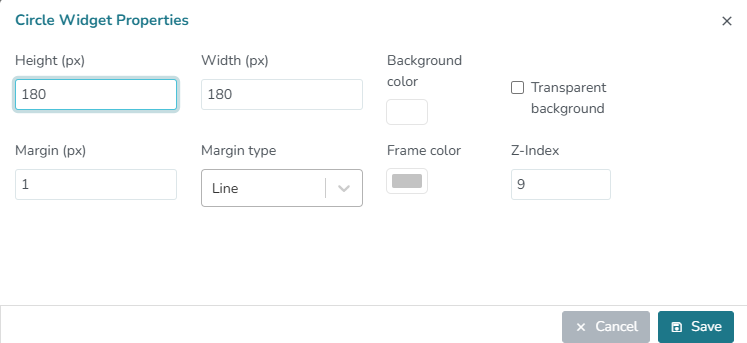
16. Circle/Rectangle Widget: These are geometric shapes that can be used to create a background or border for an item.
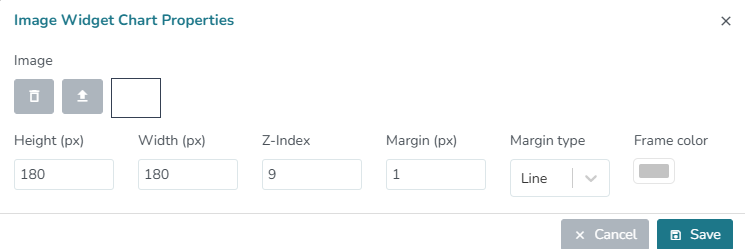
17. Image Widget: With this option, you can insert any image into the Dashboard.
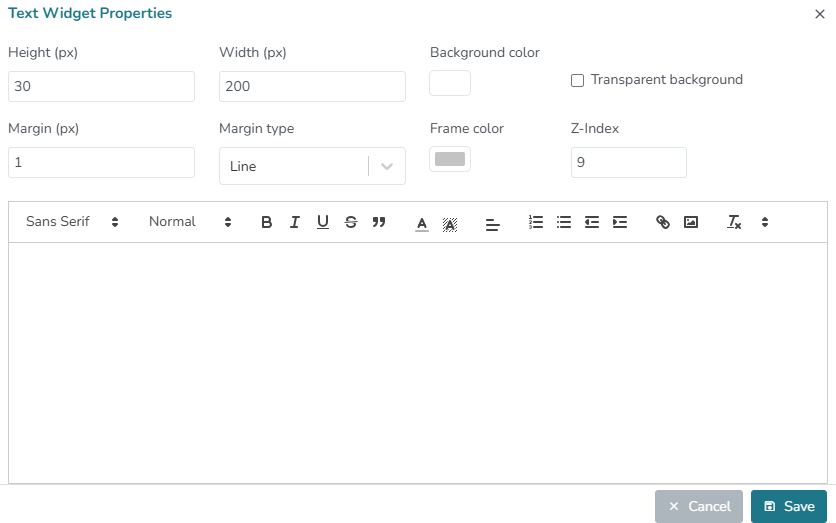
18. Text Widget: You can insert any text into the dashboard. You can enlarge it, change the color, and choose the font.
19. Link Widget: You can insert any link and access that link directly from the dashboard.
20. After you have inserted all the items you want, don’t forget to save the dashboard.
21. In addition to these options, the Dashboard has some other features.
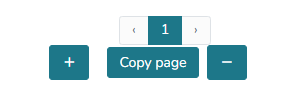
You can insert and copy pages, thus better organizing your dashboard. To create a page, access the footer of the screen. The system shows the options:
The + button allows you to create a new page.
The – button deletes the page you are on.
The “Copy page” button creates a new page with the same layout as the one you have selected.
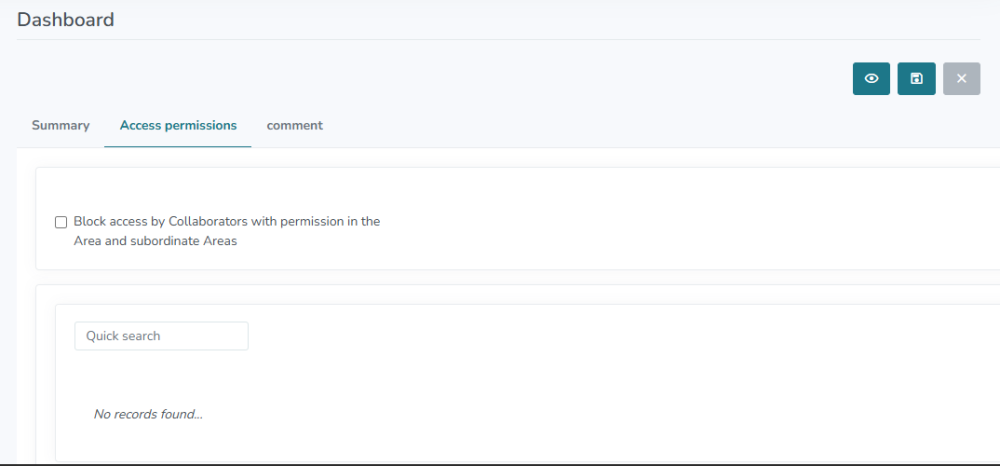
22. Access permissions tab: in this tab you can define who will or will not have access to the dashboard.
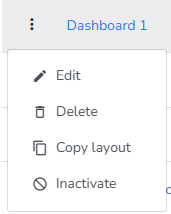
23. If you want to edit or delete a dashboard, access the Manage > Dashboard menu > Click on the three dots of the desired dashboard and click on the desired option (edit, delete, copy layout and deactivate).
The copy layout option creates a new dashboard identical to the one you are accessing. If you deactivate a dashboard, no user will have access to that dashboard anymore.
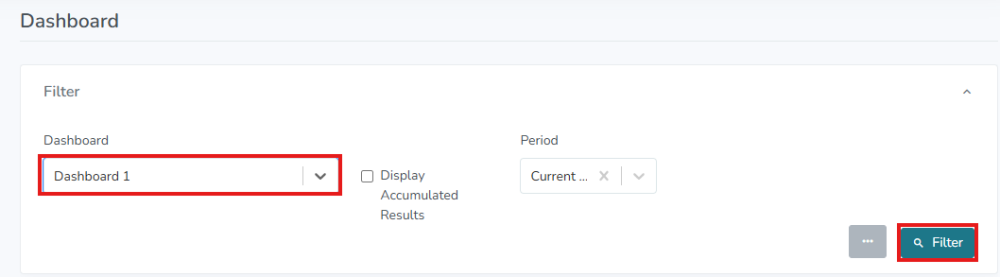
24. If you want to view the finished dashboard, go to the menu Panel > Dashboard > Select the dashboard and click filter.