
Online System / Network Adapters /
Analyze Network |
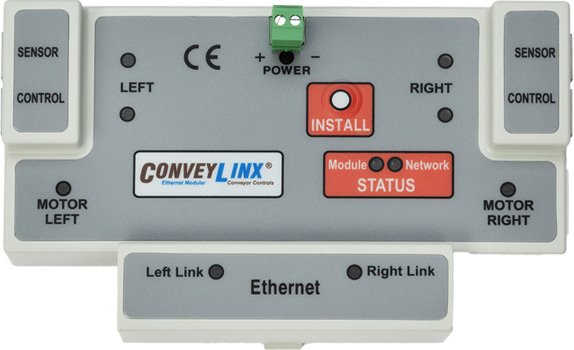
ConveyLinx ERSC ✅ | ConveyLinx-Ai 24V ✅ | ConveyLinx-Ai 48V ✅ |
 |
 |
 |
|
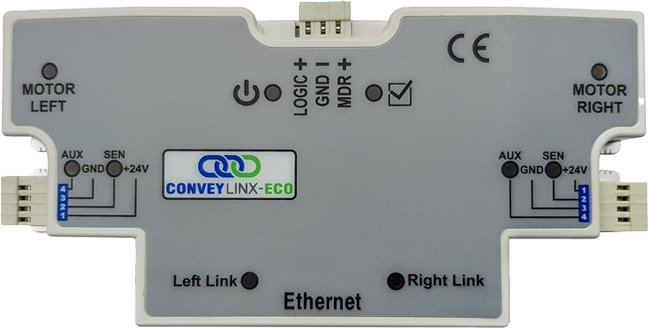
| ConveyLinx-ECO ✅ | ZPA Mode ✅ | PLC I/O Mode ✅ | |
 |
 |
 |
Analyze one of the Network Adapters from the Online System. From here you may configure your criteria before continuing to analyze the network and its settings. This is a helpful tool in debugging and troubleshooting, as well as establishing norms for the system.
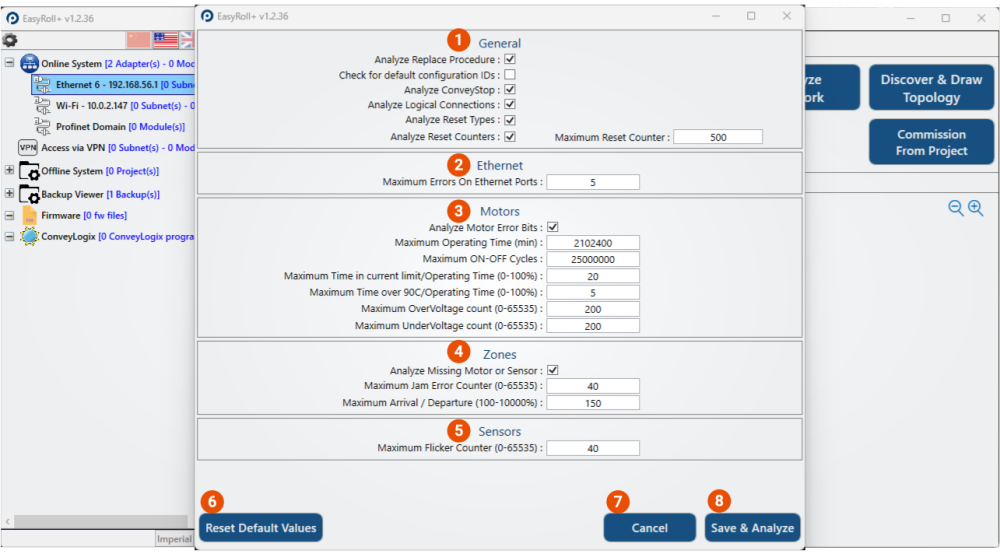
| Item | Function | Description |
| General |
|
|
| Ethernet |
|
|
| Motors |
|
|
| Zones |
|
|
| Sensors |
|
|
| Reset Default Values |
|
|
| Cancel |
|
|
| Save & Continue |
|
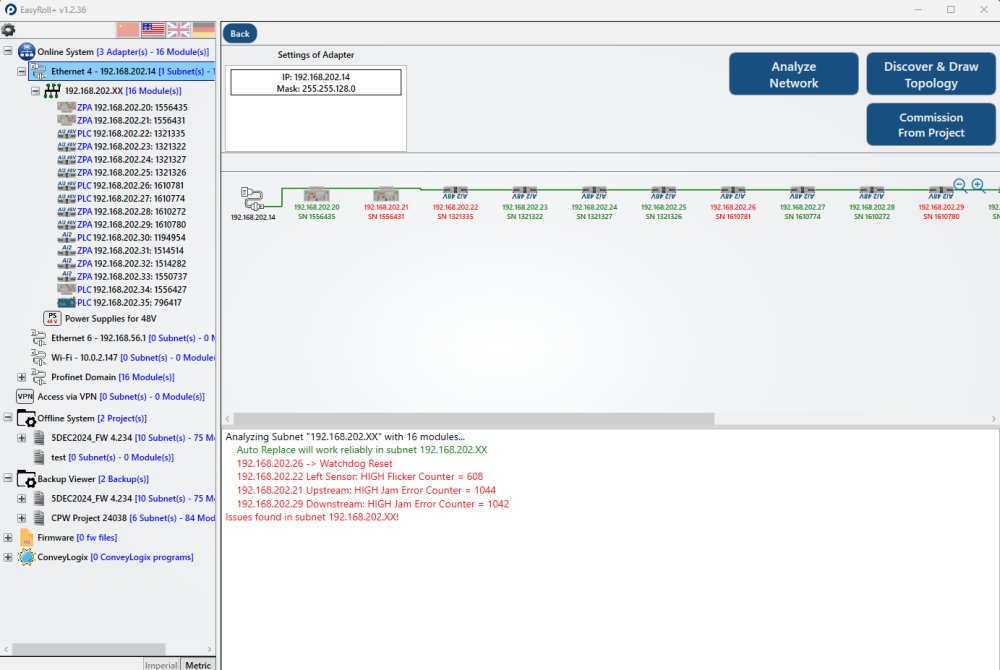
Analyzed Network Results
Once you click “Analyze Network” and set to the parameters, both an image and log will result. The image here in the middle of the page depicts each module, their Serial Number and IP Address, where they are in relation to the system, and their color coding. Red modules may have an error or simply have values outside of your set parameters from when you chose how to analyze. Green modules have no errors and all of their values fall within the parameters given. The log at the bottom third of the screen alerts you to what data has triggered the analyzer, and provides you with the IP Address of the offending module.
Post your comment on this topic.