
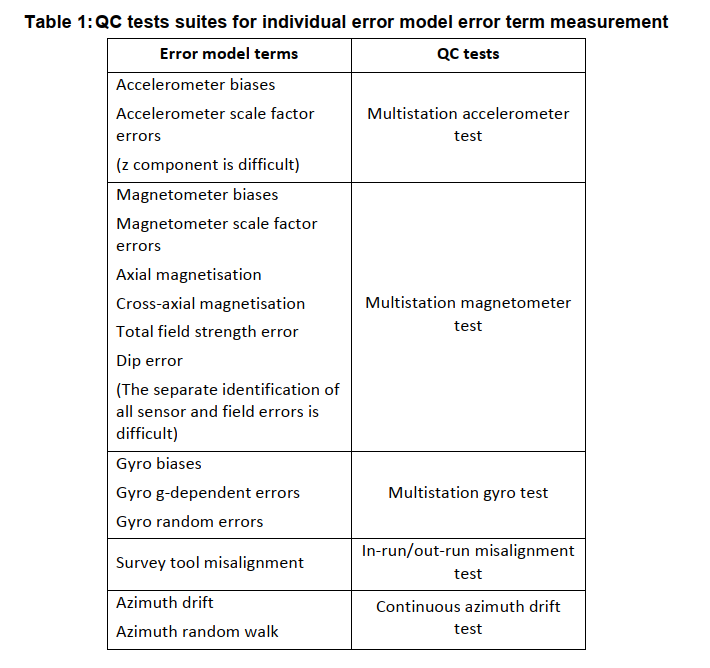
Many of the tests described in the QC chapter are based on the determination of one or more error model terms. It is possible to derive and to test existing error model inputs through statistical analyses of such QC results obtained from a large number of surveys originating from different sources and locations. However, it is important to remember that the accuracy of most of these methods is dependent on wellbore geometry and/or operational conditions. Only results from surveys matching the different test recommendations should therefore be used in such statistical analyses. An overview of the QC tests that can be used to derive the different error terms is given in Table 13.
Illustrations of the procedures adopted by one gyro service provider to generate error model validation data for a range of survey tool types is described in SPE paper 1401924.
The following example describes how multistation test data are used to quantify the major errors that are expected to arise in a gyro tool that provides stationary surveys.
Example 1. The procedure described here relates to the validation of the gyro error model for a gyrocompassing tool equipped with a single dual-axis (xy) gyro.
In addition to the gyro random noise, the following important error sources for gyrocompassing with xy gyro systems are specified in the gyro error model; gyro bias, mass unbalance, gyro scale factor errors and gyro misalignments. These highly significant gyro error sources are measured and corrected for at least once at master calibration facilities for all gyro survey instruments operated by the company. The company also corrects for the following less severe, but still significant, sources of error: input axis g-sensitive error (quadrature effect), spin sensitivity and anisoelastic effects.
While most of these terms remain constant, the mass unbalance and the x and y gyro biases are known to change with respect to the master calibration and may produce large survey errors if left uncorrected. The company operating the tools and services analyzed here has developed a number of methods to control the time dependent errors, by embedding the following processes into the standard operational software and practices:
• z axis indexing
• multistation correction
• pre and post job field roll tests
• pre and post job base roll tests
These correction methods can be looked upon as simplified recalibrations of the survey tool. The z axis indexing is designed to remove x and y biases on individual survey station basis. However, many years of
experience has shown that part of the biases, or bias-like lumped residual errors, may not be removed through the indexing process, and form apparent bias errors which tend to be systematic within a given
survey and random between surveys. The company has implemented a horizontal Earth rate based multistation correction algorithm to measure and correct for the two apparent biases and the direct mass
unbalance.
The drawback with this correction method is, as indicated in the quality control paper SPE103734, that it is not applicable for all wellbore geometries and running configurations. The multistation correction quality
depends on latitude, the amount of inclination and toolface variation over the well section surveyed, and on the dominant horizontal direction of the well. The dependency is quite complicated, and it is often difficult
to decide whether a multistation result can be trusted or not without some kind of numerical geometrical evaluation. An automatic test based on the actual latitude, the calculated correlation coefficients and the percentage of stations within an east/west sector, has therefore been integrated within the software. As a result of this procedure, the multistation correction will not usually work in connection with spring-bow
surveys (no tool rotation), tangent section surveys and surveys of wellbores that lie predominantly in an east or west direction. Geometrical tests are conducted to identify these cases, and such surveys are recalibrated with an alternative method utilizing the pre and post job roll tests as described next.
Roll test data will be needed in addition to the downhole data to produce a result with the multistation correction software when the geometrical tests fail. Roll tests obtained at the drill site a short time prior to
and immediately after a survey (field roll tests), are generally more consistent than roll tests conducted over a larger time span, tests performed at the warehouse prior to shipment and after return (base roll tests) for example. Field roll tests are therefore preferred, but experience shows that acceptable field roll tests may be difficult to achieve on floating drill-rigs like semi-submersibles, and that it often is necessary to recalibrate with base roll tests when operating from these types of rig.
Regardless of which recalibration method is used, it is concluded from the discussion above that error models for all tools used in this study require only the following four sensor dependent gyro errors from the
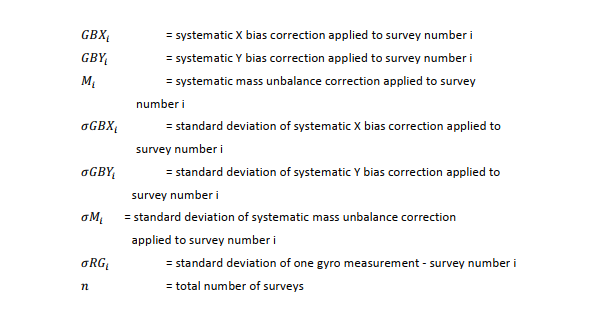
list of options given in the gyro error model paper4: the apparent gyro bias errors (GBX and GBY), the direct mass unbalance error (M) and the random gyro noise (RG). Nevertheless, it is necessary to populate these terms with numbers derived independently for each of the recalibration methods. Both the multistation correction and the different roll tests provide estimates of GBX, GBY and M, their standard deviations (σGBX, σGBY and σM), and the random noise (RG). The necessary numerical error model inputs can therefore be derived through statistical analysis of multistation correction results from the different surveys and tools.
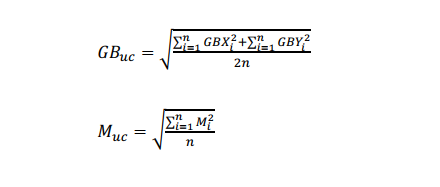
The multistation corrected/uncorrected error models are most simple to derive since a one to one relationship exists between the test output and the input values required for these model inputs. A
multistation uncorrected model must not be misinterpreted as an error model that can be used regardless of quality control level. As described above, multistation corrections will not usually be applied to surveys of east-west wells and tangent sections, or where the toolface does not vary significantly without the use of roll test data in the test. The uncorrected systematic parameters (GBuc, Muc) are given as the zero mean standard deviation of the actual corrections given in the following equations.
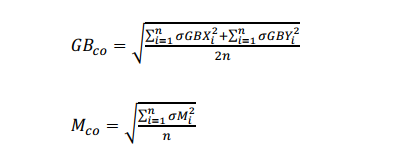
The corrected systematic parameters (GBco, Mco) are given as the root-sum-square of the estimated standard deviation of the actual corrections given by the equations below.
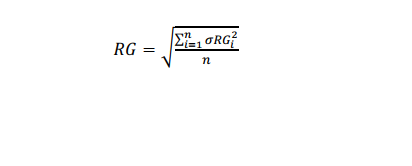
In both cases, the random noise parameter (RG) is given as the root-sum-square of the actual random output as defined in equation 7. It must be noted that only results passing the internal correlation coefficient and east/west tests should be used in these equations.
The numerical values selected for these error parameters vary not only with the sensors used and their configuration, but also with the choice of running gear and the platform from which the system is operated.
The corrected model should always be employed provided that all QC requirements are satisfied; standard operating procedures dictate that the gyro measurements are always corrected using the multistation
estimates of gyro bias and mass unbalance under such conditions. The uncorrected values serve purely to define the corrections applied (1σ values) following the successful implementation of the multistation
correction QC procedure. It is noted that gyro biases propagate randomly for operation in a rotating survey tool, while bias propagation is systematic if the tool is not rotating. Mass unbalance always propagates as a systematic error, regardless of the running conditions.
Similar statistical analyses of other QC test results can be used to quantify other sources of error in survey tools. The following example outlines the use of data obtained using the in-run/out-run misalignment test
described in the QC chapter.
Example 2. Consider n independent continuous gyro surveys from different sources/locations that have been run on roller centralisers, and that have all been subjected to the in-run/out-run misalignment test and satisfied the requirement of that test. Misalignment estimates MXi and MYi will then be available for each of these surveys (1 ≤ i ≤ n). The individual misalignments all have zero expectation, and the standard deviations of the misalignment errors, the error model misalignment input, can be calculated using the following equation.
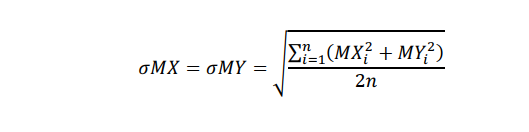
Surveys with known gross errors should not be used in this standard deviation calculation as they can distort the results substantially.
Post your comment on this topic.