
Uncertainty modelling provides a method of determining how far out we might be when we estimate something. This can be very useful in all sorts of fields. If for example I were to take a bet on the height of the next person to walk down the street, I would want to know, first of all, what was the normal range of heights for people and even then I would not bet on the average. I would be much safer to bet that they fall between say 0.2 – 3.0 meters high so that I am confident that my bet is ‘safe’.
In order to establish a ‘safe’ bet I need to know both the average and the range of the measurement I am trying to estimate. The German mathematician, Gauss described the ‘Normal Distribution’ of naturally occurring measurements (of which our heights are one). In this graph the x axis is height and the y axis describes the number of people in a given sample that might fall in a given height range.
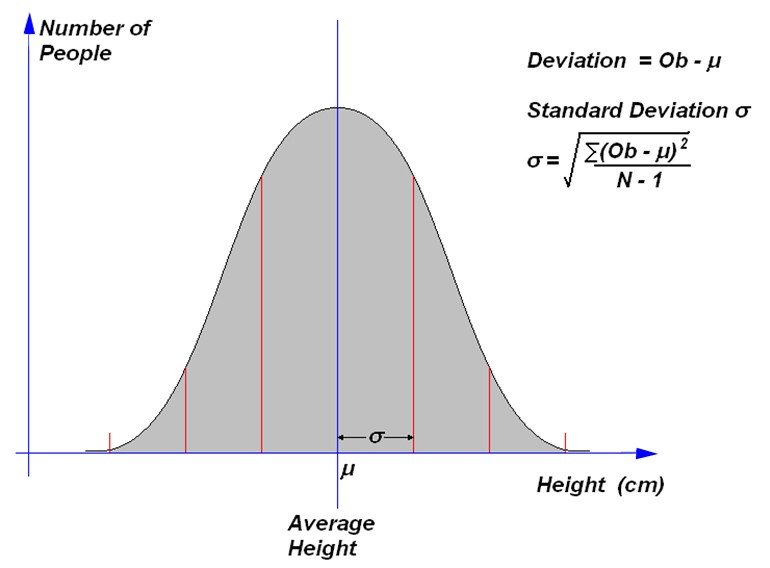
In this diagram the average height is in the centre and it can be seen that most people fall close to the average. The deviation of any observation is just how far it is from the average. For example if I am 1.80m tall and the average is 1.50m, my height “deviation” would be 0.3m. Notice that the greater the deviation from the average, the fewer people there will be.
The formula shows a useful parameter, the “standard deviation” which is the square root of the sum of all the deviations squared, divided by N-1 where N is the number of the sample. This number is used a great deal in uncertainty modelling and serves as a measure of the distribution around the average.
We usually use the Greek letter sigma (σ) for standard deviation.
For naturally occurring measurements Gauss showed that about 67% of observations will fall within 1 sigma, 95% within 2 sigma and 99.7% within 3 sigma. So if sigma is 0.2m and the average was 1.50m, I could bet on the next person to be between 1.3 and 1.7m and my “confidence” would be 67%. I am a Scotsman, not known for being overly generous so I may decide to bet at 2 standard deviations and say that the next person will be between 1.1m and 1.9m. Now my “confidence” goes up to 95%. If I am still worried, I could bet between 0.9m and 2.1m and now I would only be wrong 3 times in 1000 or 99.7% confident. Clearly with a critical estimate we would want a confident result. In theory it is not possible to obtain 100% confidence with the Gaussian model so we have set the limits somewhere. This is often referred to as “setting the sigma levels” and the higher the sigma levels, the lower the risk.
It should be noted that in nature nothing follows the Gaussian Model exactly. For example, we know that there are no people 3m high in the world so very low risk values are often ignored.
Post your comment on this topic.