
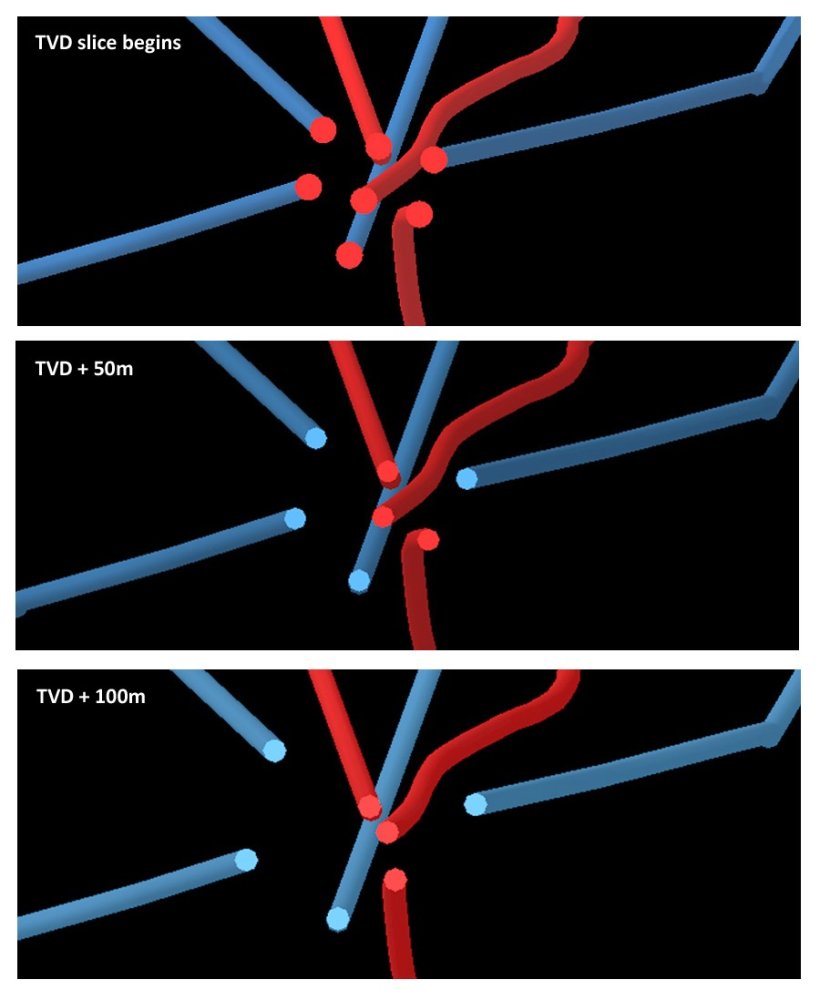
TVD “Crop” Diagrams are useful in determining the relative positions of wells when the inclinations of ALL the wells being viewed all have inclinations which are LESS THAN 60°. This diagram slices the wells along a TVD plane and presents a view of them from above. They are particularly useful in top-hole drilling to examine the trends and help visualize the clearances at each level. They are also a great aid when having collaborative discussions with either the office or client if all parties have a copy of the diagram to view.
This diagram represents a ‘slice’ through the wells at a given TVD which can be advanced and the relative positions of the wells are updated in real time. As you continue drilling down the actual well, the start of the slicing should be incremented to match the latest TVD achieved. The examples represent the well as the 0m, 50m and 100m TVDs are reached.
Post your comment on this topic.