
Although Minimum Curvature is now considered the indisputable industry standard for survey calculation, another method was developed in the early 1990s known as Varying Curvature. It turns out that the VC method produces very similar results to Minimum Curvature but has the advantage that it can be used to perform QC on whole surveys to check for poor consistency in the data.
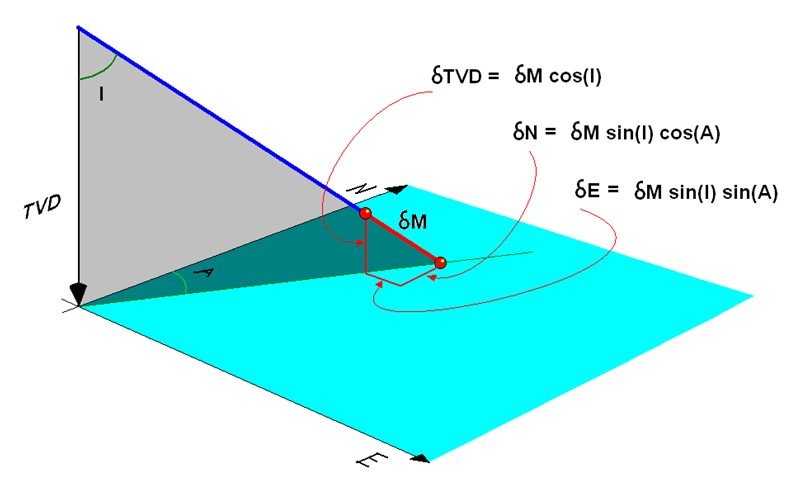
Consider again the effect of a small increase in MD along a particular inclination and direction
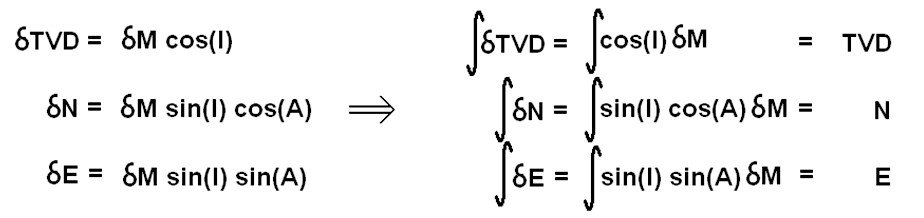
If we were to produce a set of graphs where the x axis is measured depth and the y axes were respectively cos(I), sin(I)cos(A) and sin(I)sin(A) then we can use the fact that the integrals of each would be the accumulated sums of TVD, Northing and Easting.
In the graphs below, the y axis is used to plot the terms shown for each observation and if a smooth curve is drawn through the observed points, the TVD, Northing and Easting (from the start of the well to any MD) are simply the areas under the graphs
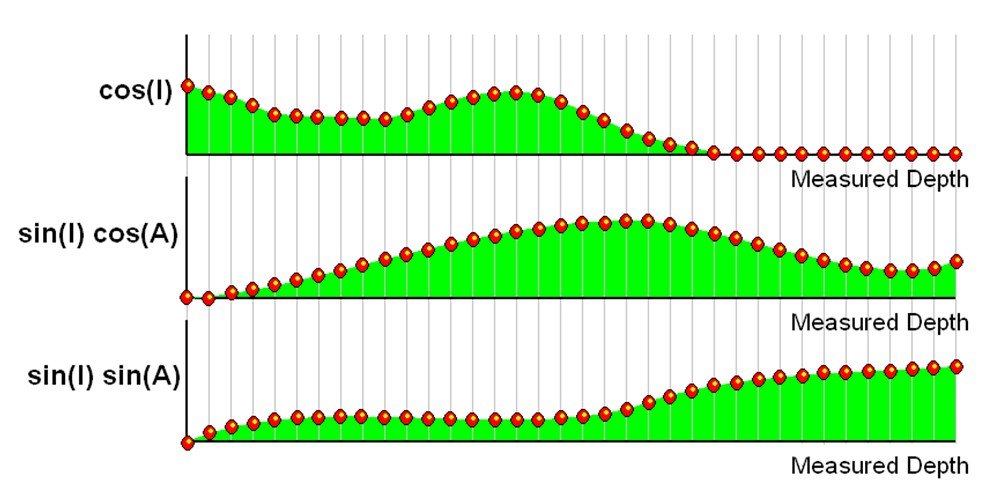
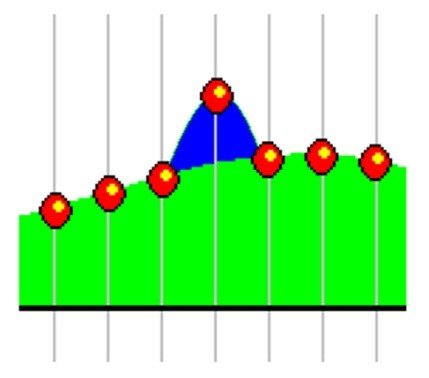
The area of the cos(I) graph is the TVD, the area of the sin(I)cos(A) graph is the Northing and the area of the sin(I)sin(A) graph is the Easting. By fitting smooth curves through the points, the curvature of the wellpath effectively varies smoothly through the survey rather than being fixed to a given radius between observations. Now consider the effect of a poor survey on the above graphs.
The inconsistent survey will ‘pull’ the area towards itself and the difference it makes can be determined by the difference in the area (The blue region in figure above). In other words, varying curvature can compare the area under any of the three graphs, with and without a given survey observation and determine the effect each observation has on the wellpath position. Surveys consistent with those on either side will have very little effect if they are removed. This produces a 3D vector ‘shift’ in TVD, Northing and Easting created by the rogue observation. This vector can be split into a high/low side component and a left/right component and plotted against measured depth for a very useful consistency ‘signature’ known as a varying curvature analysis. This provides the surveyor with a digital spellchecker on his data since any typing errors will show up as highly inconsistent with the surrounding surveys.
Post your comment on this topic.