
The ladder plot is simply a graph of the separation to target wells against the measured depth of the planned well. They are very useful for determining which well to watch for at which depth.
The y-axis can either be the true centre to centre distance or more usefully, the inter-boundary distance of the zones of uncertainty to the object wells.
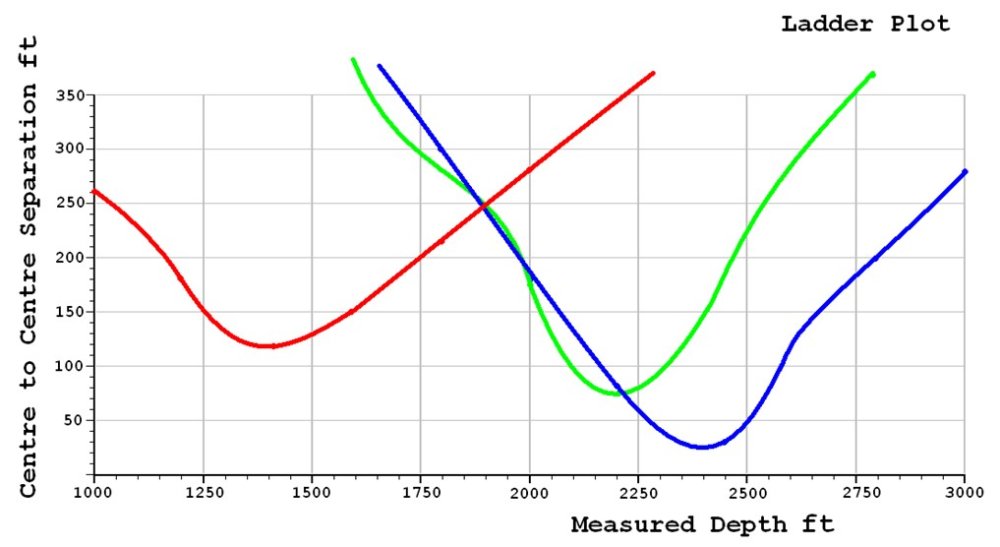
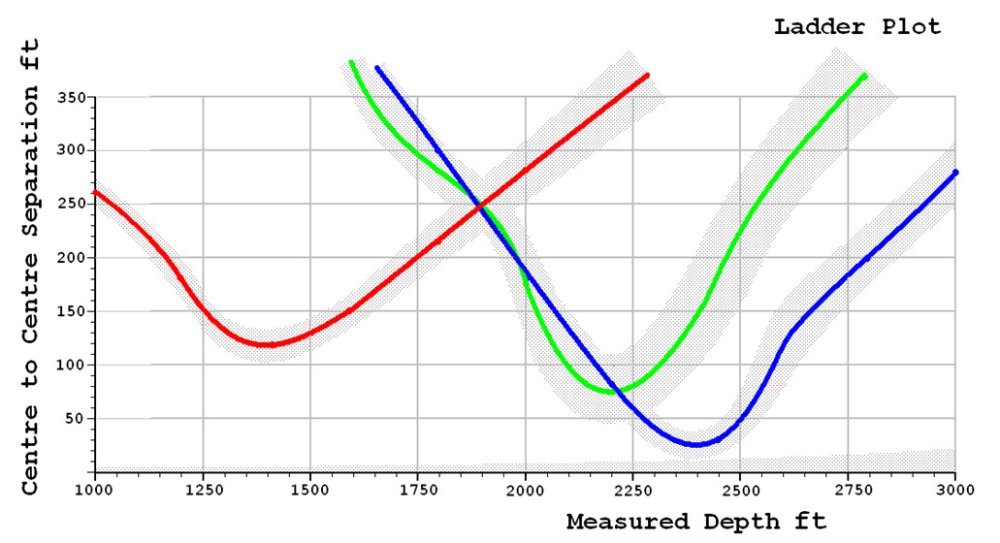
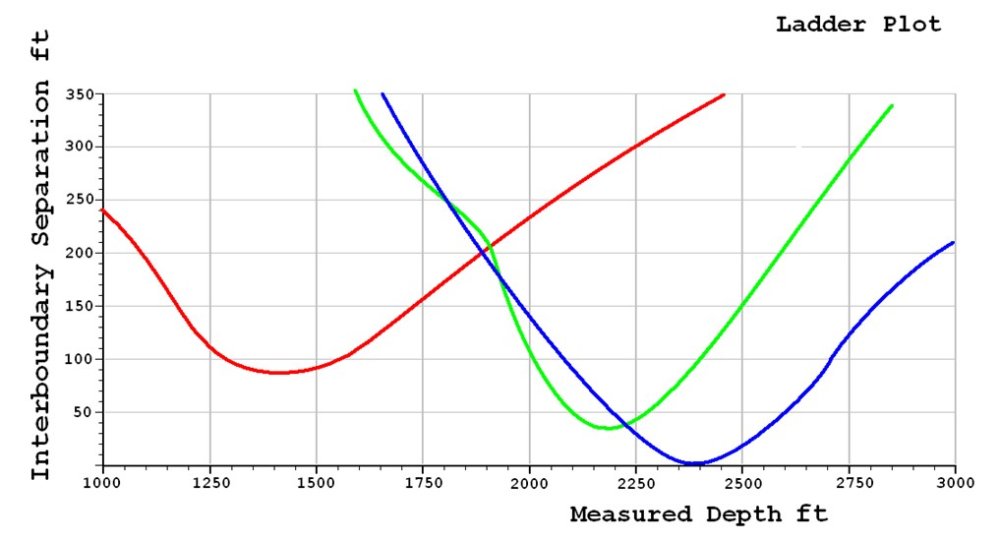
In these examples you can see that the most dangerous hazard is the blue well at the planned well’s interval between 2350 ft. to 2450 ft.
Feedback
Copyright © 2025 ISCWSA eBook
—
Powered by 
Post your comment on this topic.