
These plots were used regularly in the days before computers and 3D visualization software. They are still used on many rig sites where 3D visualization is unavailable. Following the examples and text below should enable you to read and understand traveling cylinder plots. Consider these screens like a radar scan when travelling down the planned trajectory.
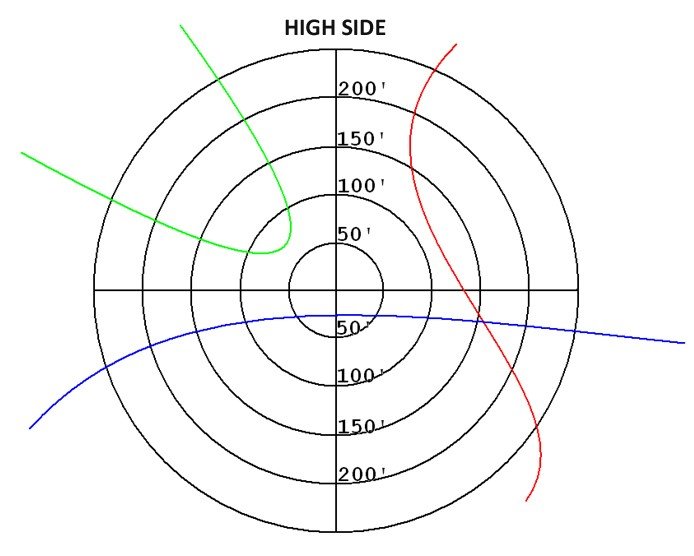
This scan shows the basic radar screen out to a range of 250 ft. Our well passes to the left of the red well, beneath and to the right of the green well and over the top of the blue well.
At their closest points the red well comes within 120 ft., the green well comes within 70 ft. and the blue well within 30 ft.
It is useful then to include marker points on the object wells for each MD in our well at some reasonable interval. This shows us where that well will be relative to us when we reach that depth.
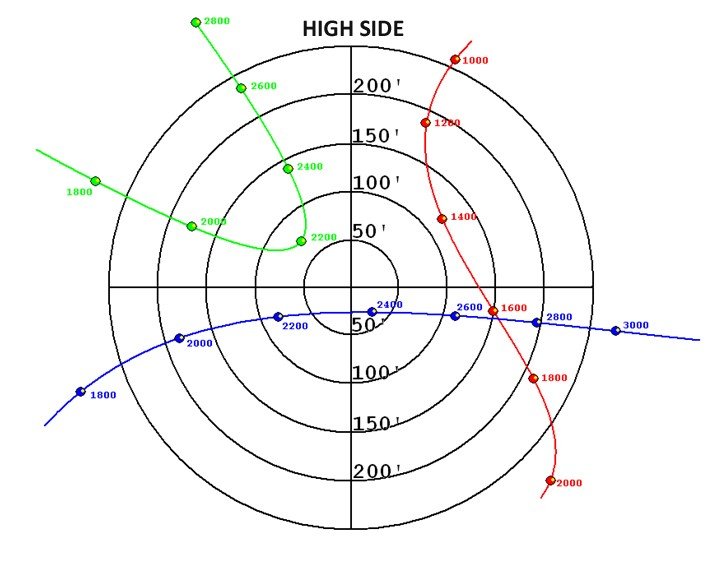
Then it is also useful to include the uncertainty around the wells. This is best done by combining our uncertainty with the object well uncertainty and showing that as a simple offset towards us to create a ‘no go’ boundary for the other well.
Now we can see that the green and blue wells might be dangerously closer than we think. To avoid the blue well we would want to be above our current plan around 2300 ft. and to avoid the green we should perhaps be a little more to the right.

Post your comment on this topic.