
Diagrams serve as the primary visual representation of business processes. They enable organizations and users to map out their processes and furnish key stakeholders with process-specific information. Diagrams offer users a high-level overview of processes, including associated roles, resources, and essential materials and documentation.
The diagram view presents an expanded view of your entire process in a flowchart, swimlanes or matrix process map format. It displays flow objects and associated elements on the map according to your defined display settings.
In this topic, we will explore various process map & diagram types, as well as the components and functionalities of the process diagram view.
Process Map Types
In EPC, you have access to various map types for process mapping, including:
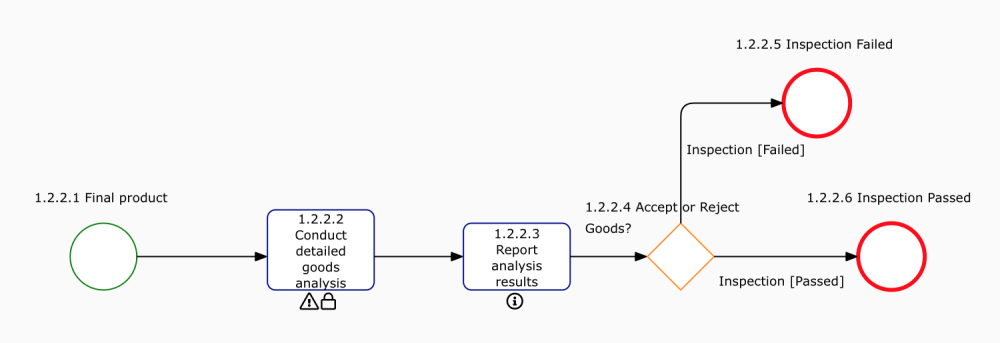
- Flowchart: This enables you to visualize processes in a traditional flowchart format, providing a comprehensive overview of the business process, highlighting key activities and associated elements.
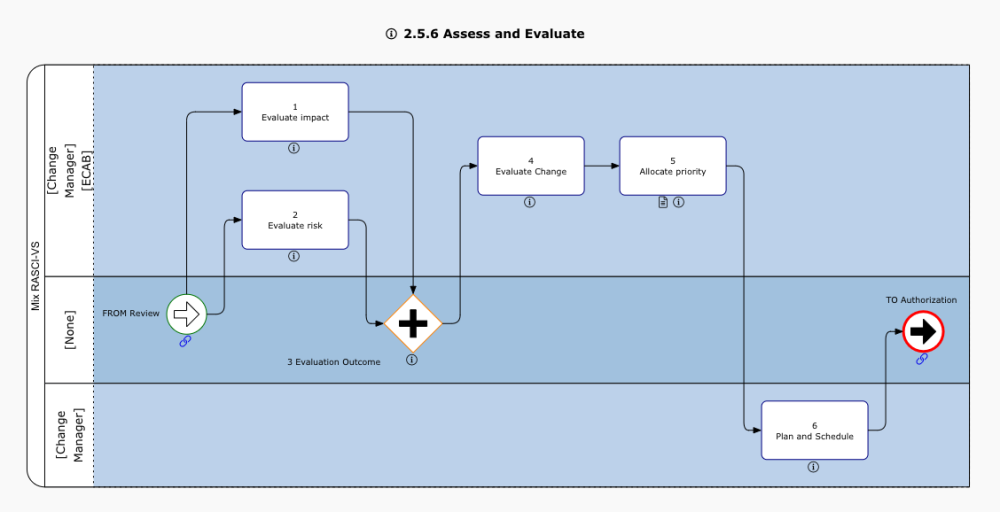
- Swimlanes: It enhances your process view by segmenting the flow of work into lanes based on organizational units, resources, and roles, highlighting key individuals involved in the workflow. Users can also customize the Swimlane by changing the axis in Map Options, with multiple options such as assets, documents, risks, controls, performance indicators, and more.
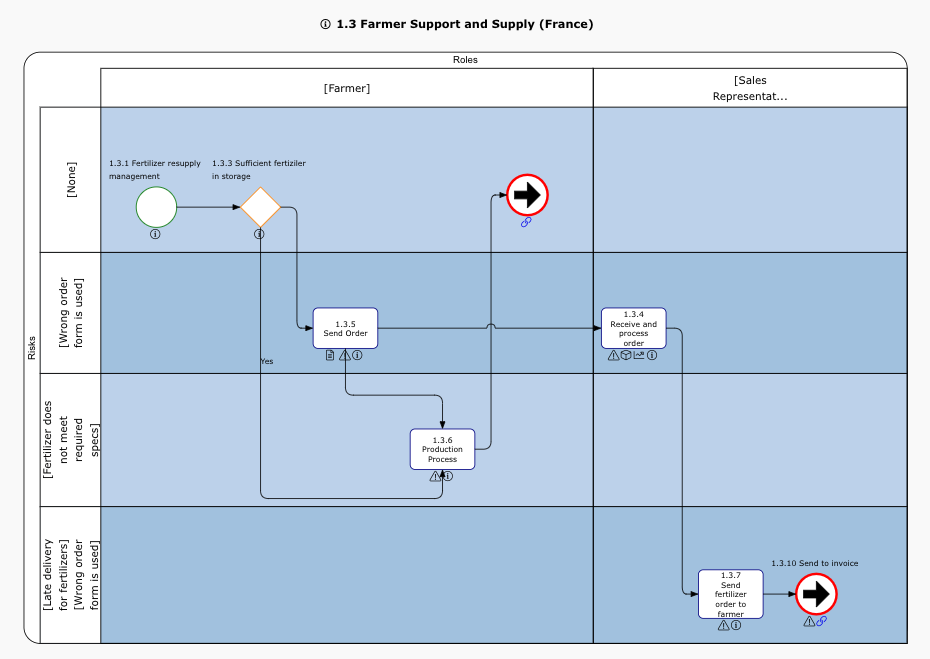
- Swimlanes Matrix: This view extends your perspective by dividing the flow of work into a matrix of Swimlanes. You can define parameters for both axes in Map Options, allowing for multi-dimensional process analysis. It reveals various divisions within the process and the interconnected relationships between associated objects and details.
Process Diagram Types
In addition to the ‘Map’ diagram type, EPC provides two other types:
- Hierarchy: It visualizes both vertical and horizontal hierarchies of sets, folders, and individual objects, offering a graphical representation of object placement within the organizational structure. This helps users understand documentation and assess business activity complexity. Users can expand and collapse items within the graph using the ‘+’ and ‘–’ buttons.

- Impact: This diagram visually represents upstream and downstream associations between items in EPC, offering insights into item connections and helping users understand the complexity of specific business activities and the impact of organizational changes. It offers an initial visual representation of items with direct impacts on each other, and users can explore indirect connections by double-clicking on an item within the graph to reveal their associations.
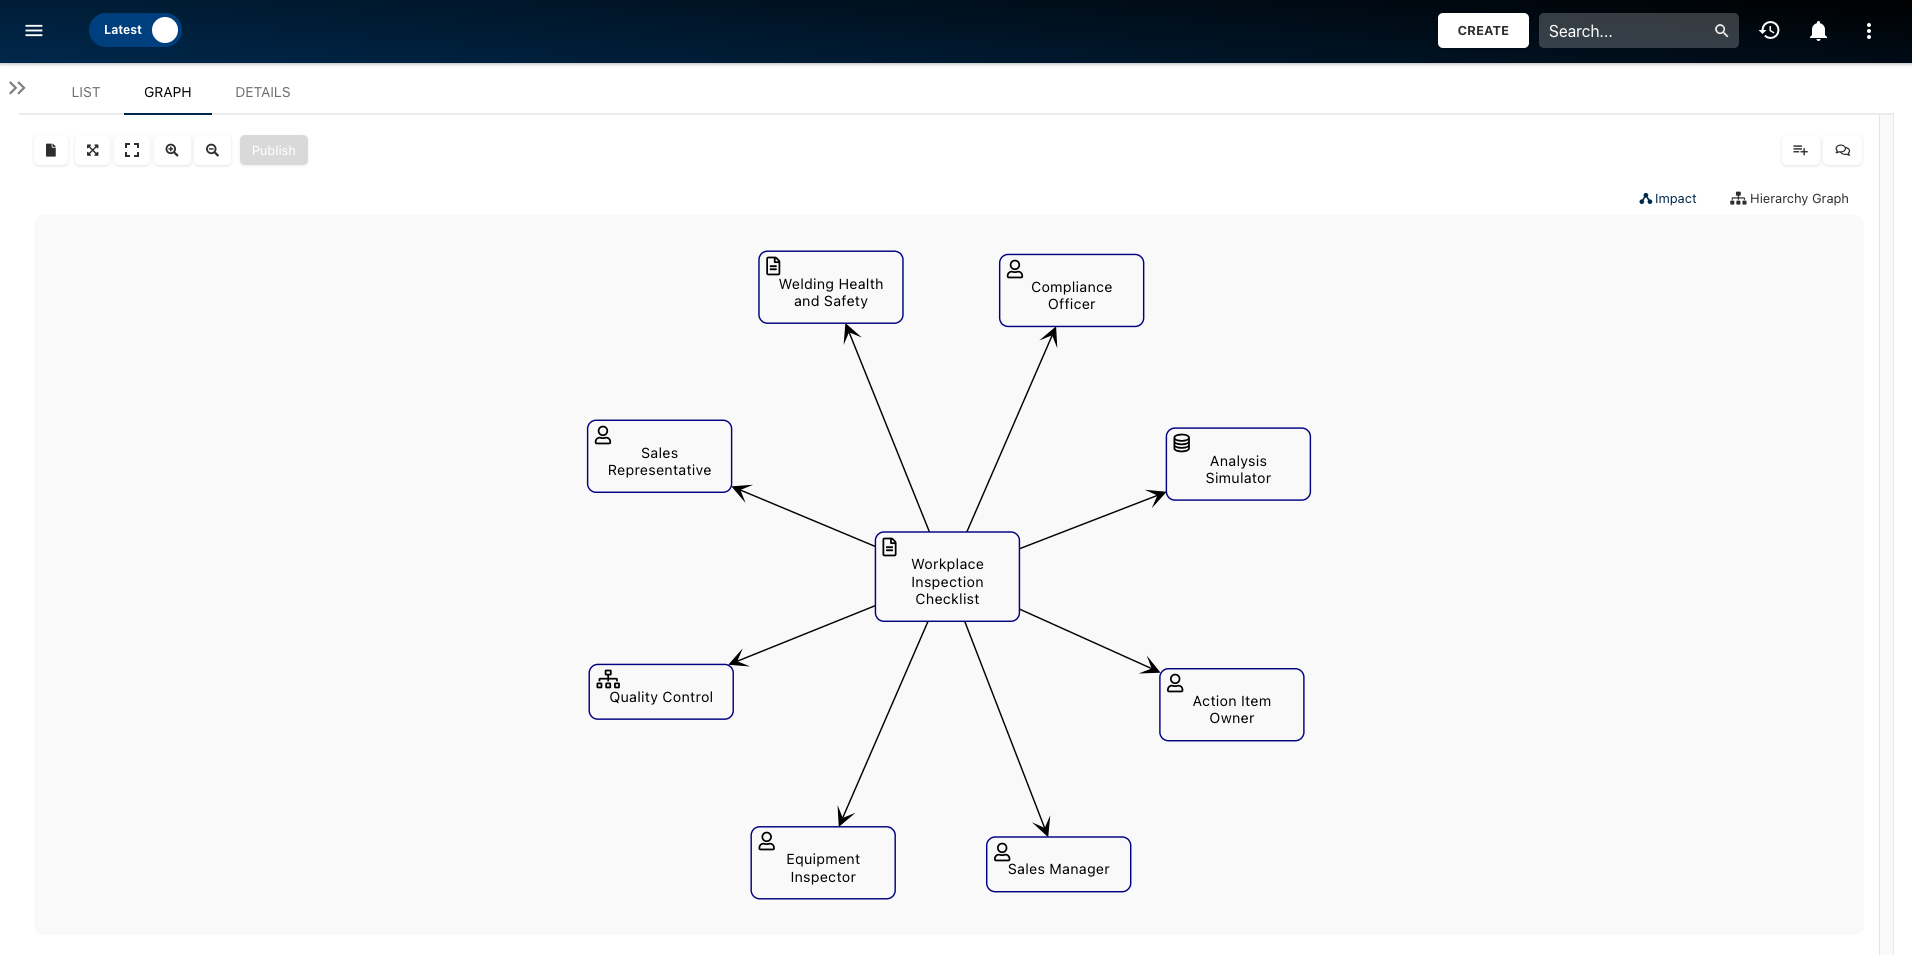
Diagram View Components & Functionalities
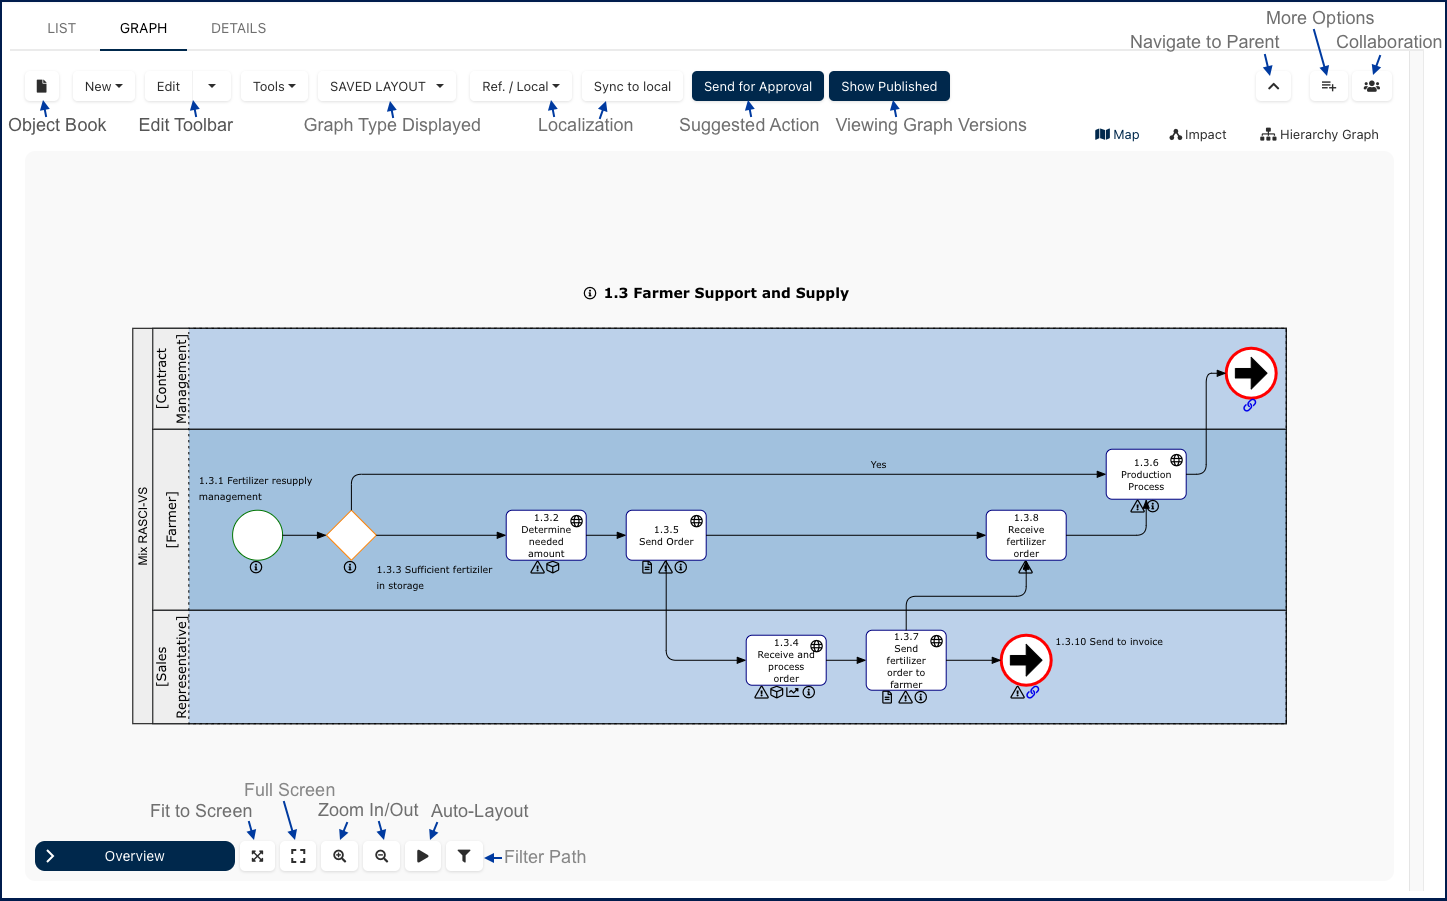
- Object Book: Generates an object book for the selected object.
- New: Allows to create a child process.
- Edit Toolbar: Accesses the diagram editor and additional editing options, including endorsement, approval, security, merging, and more.
- Tools: Contains extra functionalities like audit trail, browse versions, and more.
- Diagram Type Displayed: Switches between different diagram views, including saved layout, flowchart, swimlanes, and matrix.
- Localization: Allows users to create localized copies of processes, customizing their properties and characteristics to suit different locations, products, or services. Localization options are as follows:
- Ref./Local: Allows users to switch and view referenced or localized copies of this process map.
- Sync to Local: The process will automatically sync with all its local processes and flow objects copies, except those that have been removed from the sync.
- Suggested Action Button: When you possess the appropriate security permissions and are in the ‘Latest’ mode, a suggested action button will appear. This button dynamically changes based on the next action required or available. For instance, if there’s a pending approval request, the button will display ‘Cancel Approval Request.’
- Viewing Diagram Versions: When you possess the required security permissions and the object is in the ‘In Progress’ status while you’re in ‘Latest’ mode, you’ll encounter the ‘Show Published’ button. Clicking on this button allows you to view the currently published diagram. However, if you’re already in ‘Published’ mode, this button will transform into ‘Show Latest,’ which, when clicked, will switch you back to the in-progress diagram view.
- Navigate to Parent: Automatically navigates to this process’s parent.
- More Options Menu: Provides additional choices like download, print, subscribe, favorite, share, map settings, and sync. To learn about all available options within this menu, please click here.
- Collaboration: View and create collaboration topics (excludes sets and folders).
- Map, Impact & Hierarchy Buttons: Toggle between diagram views: map, impact, and hierarchy.
- Overview: Move and navigate through the diagram within the window.
- Fit to Screen: Centers the diagram on the page.
- Full Screen: View and navigate the current diagram in full-screen mode.
- Zoom In/Out: Zoom in or out of the current diagram, also accessible via mouse scroll wheel.
- Auto-Layout: Optimizes the diagram layout after user edits, providing a temporary, user-localized adjustment for improved viewing.
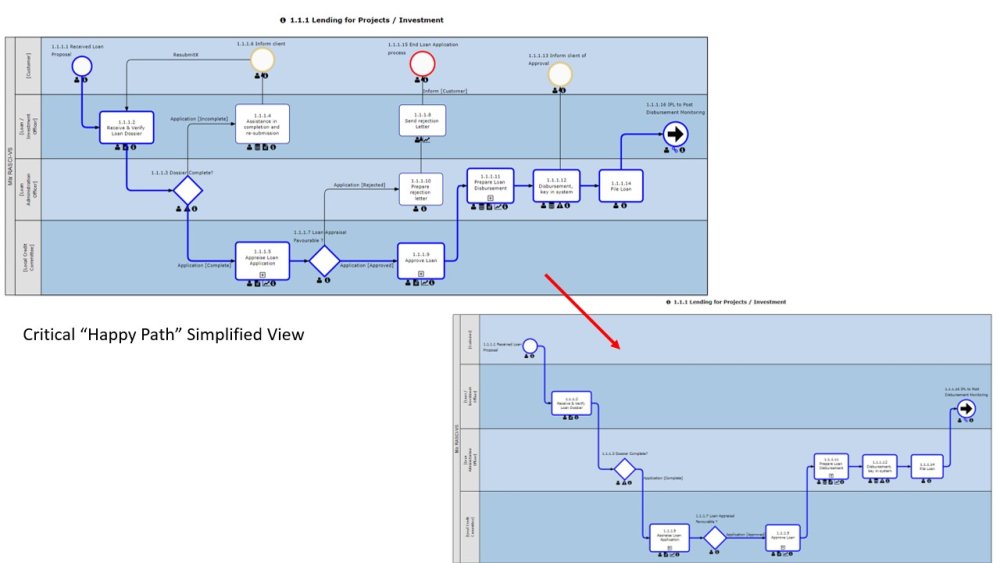
- Filter Path: Filters the diagram to display only the critical path, which represents the process’ ‘Happy path,’ as shown below:
![]()
Haben Sie noch weitere Fragen?
Visit the Support Portal