
ROB-EX Scheduler HTML reports support the generation of a number of different reports. The reports are 100% HTML-based, so you can save the reports on a file server or intranet, where readers can easily access them using a web browser.
This chapter describes:
Generate HTML report.
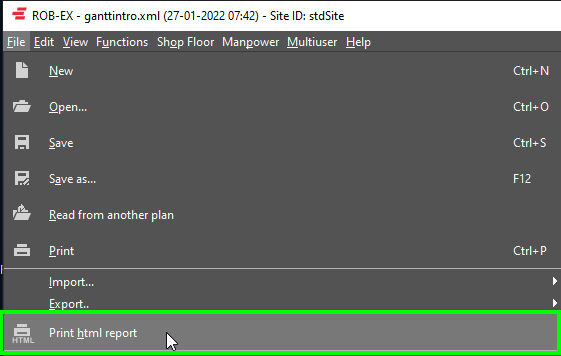
You generate an HTML report by selecting “Print HTML report” in the Files menu or directly clicking the “Print HTML report” button from the toolbar.
Open HTML reports from the Files menu:
Open HTML reports from the toolbar:

The Print window is shown:
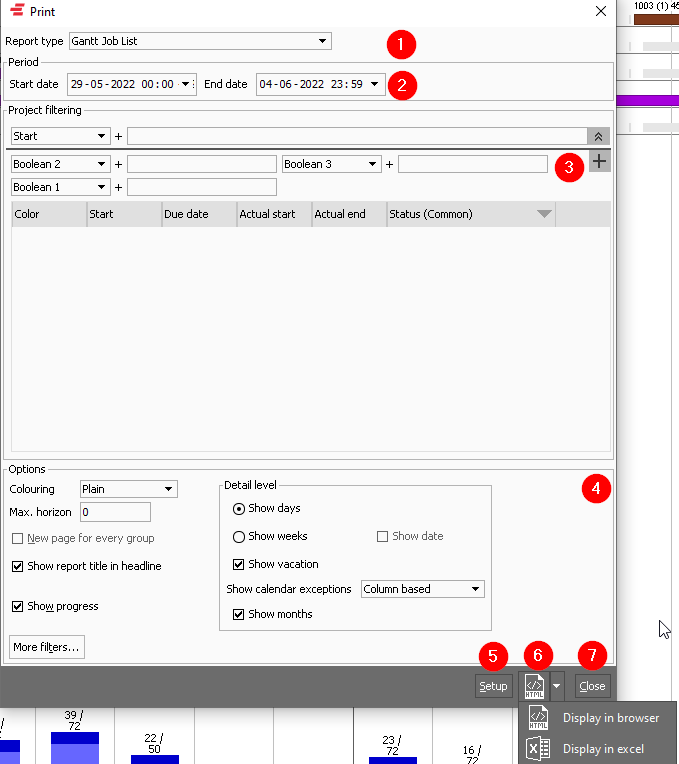
 Report type
Click in the drop-down to choose what kind of report to print. Below the different report types are described.
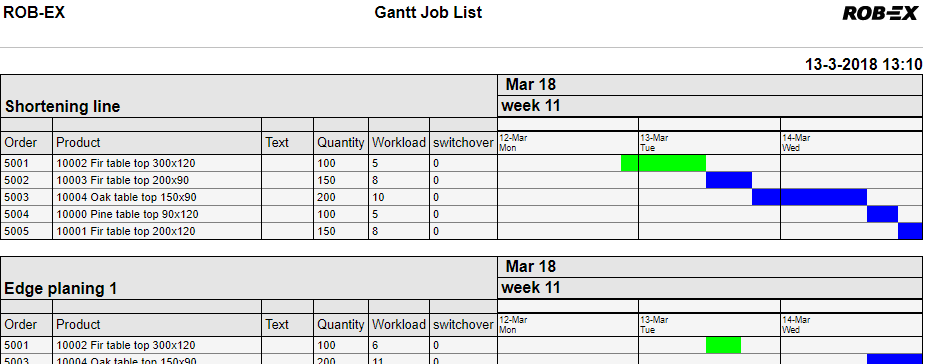
| Gantt Job List | Job list with a right side Gantt chart. The Gantt bars are filled with a solid color |
| Gantt Job List (hours/total hours) | Job list with a right side Gantt chart. The Gantt bars are filled with a solid color. In addition, the total hours available and scheduled are displayed as figures at the bottom of each resource Gantt chart. |
| Gantt Text Job List (hours/total hours) | Job list with a right side Gantt chart. The Gantt bars are filled with the amount/quantity assigned to each day. The total quantity available and scheduled are displayed as figures at the bottom of each resource Gantt chart. |
| Gantt Text Job List (quantity/total quantity) | Job list with a right side Gantt chart. The Gantt bars are filled with the amount/quantity assigned to each day. The total quantity available and scheduled are displayed as figures at the bottom of each resource Gantt chart. |
| Table Job List | A plain table-based Job list (without right side Gantt chart). |
| Follow-up list | A special report containing all non-completed operations with an end date before now. I.e. all operations with a status below Completed with an end date before now. All operations are merged into a single table sorted by the end time of the operation. I.e. really late operations are sorted first. Note that by default this report will look back 2 months in time for uncompleted operations. |
The following project-based reports are available. I.e. the operations assigned to individual projects are the base of the report. Select in the Project section to limit what projects to include.
| Gantt Project Job List (ordered by operation start) | Each table of the report is a single project, with all operations shown in the operation start sequence. |
| Gantt Project Job List (ordered by project setup) | Each table of the report is a single project, with all operations shown in the sequence in which they are configured inside Edit->Projects |
The following material-based reports are available. Click More filters to limit what materials to include in the report.
| Material inventory | Shows a list of materials including the current inventory (opening stock). The inventory is calculated on the date and time specified in the Start date field. Warehouse and possible categories are not considered, i.e. it will be an inventory sum across all warehouses and categories. |
| Material inventory min/max (all). | Shows a list of materials including columns showing when respectively the material reaches the minimum and maximum inventory. The analysis is carried out in the time period between Start date and End date. Warehouse and possible categories are not considered, i.e. it will be an inventory sum across all warehouses and categories. |
| Material inventory min/max (critical) | The same report as “Material inventory min/max”. However only materials going below minimum safety stock (min limit) are included. The analysis is carried out in the time period between Start date and End date. Warehouse and possible categories are not considered, i.e. it will be an inventory sum across all warehouses and categories. |
| Material production | Shows the total sum amount consumed in the specified time period between Start date and End date. Not grouped, i.e. each row is a single material. I.e. only materials for consuming BOM lines in the period are included. |
| Material consumption | Shows the total sum amount consumed in the specified time period between Start date and End date. Not grouped, i.e. each row is a single material. I.e. only materials for consuming BOM lines in the period are included. |
| Material transactions | Shows all transactions (counting, purchase, shipment) grouped by material. Only transactions in the specified time period between Start date and End date are included. |
 Start date and End date
Select the period to be shown in the report using the fields Start date and End date.
In the settings, it is possible to set the default relative start- and end dates when you open the Print window.
 Project filtering
Select the project to be shown in the report Project job list.
 Options
Coloring
Select how operations are colored for Gantt chart type reports. Select between:
- Plain – operations have the same red color
- Order color – operations follow the production order color
- Route color – operations follow the production order route color
- Operation state – operations follow the standard operation state colors. E.g. blue for Start possible, green for Started, etc. One exception is that the color of Planned operations is pink since the standard Planned gray color is not distinct enough, compared to the Gantt chart background color.
- Order state – the same as for Operation state, with the difference that the production order state is used
- Resource – operations color follows the color of the currently assigned resource
- Project – operation color follows the project color – or red if not assigned to any project
Show report title in headline
When checked the report title will be shown as the headline as per the examples above.
Show progress
When checked progress will be displayed in the reports when relevant and according to the configuration.
New page for every group
Put every group (e.g. typically a resource) on a new page. When the report is viewed in a web browser page breaks will not be visible, but when printed to a printer the page breaks are activated
More filters
Select the resources to be shown in the report using the Filter function.
The Filter function uses the view made in ROB-EX Scheduler. Please refer to chapter The Gantt chart for instructions on how to create resource views.
Detail level
You can choose whether to display days or weeks and for each option whether to display dates. The examples on the next pages have all been generated displaying weeks without dates.
Show vacation
When checked a row displaying information on holiday calendars is included if applicable.
Show calendar exceptions
This option is only applicable for Gantt Text Job List – hours/total hours reports.
Select whether you want to display a row regarding calendar exceptions.
Select between:
- No
- Column based – displays calendar exceptions as a column on the resource
- Row/operation based – displays calendar exceptions as a row on the resource
 Setup
Setup
Set parameters for generating and storing the HTML report.
Start date
The relative start date for the report. The start date is relative to “today”, “this week” or “this month”.
The start date in the Print window will be adjusted according to the relative start date.
End date
The relative end date for the report. The end date is relative to “today”, “this week” or “this month”.
The end date in the Print window will be adjusted according to the relative end date.
Save reports in
Sets the catalog- and filename where to save the HTML file.
The report is saved when the report is generated with the function “Show in browser” in the Print Window.
Min. operation width
Sets the minimum operation width in percent of one day.
It can be difficult to see small operations in the Gantt chart. Use this factor to set a minimum width of the operations.
In the example above the minimum operation, width is set to 1 . An operation of 1 hour has a width of 1/24 of a day, equivalent to ca. 4.
In the next example, the minimum width is set to 15%. An operation of 1 hour has a width of a minimum of 15% of the day.
Browser
Select the browser to be used to show the report.
Share the reports
Share the reports by selecting where to save the reports under Settings. Please refer to chapter Settings”. When the report is generated the new plan is automatically saved in the selected report HTML file.
Let other people have access to the plan file by saving it on a file server. Save the plan file in the same folder and in the same filename every time.
The file that the report is saved in, is loaded into the web browser by the user who wants to see it. Use the browser update function to load the newest plan.
 Generate the report
Generate a report by pressing the “Display in browser” button. The report is now generated and then shown in the standard web browser. The other opportunity is to print the report in an excel document.
The resources are shown in the HTML report in the same sequence as ordered in the resource view in the Gantt chart. If another sequence is wanted this must be changed in the Gantt chart. I.e. you may even add a resource view only being used when printing HTML reports.
 Close
Close
Click the close button to close the view.
Example of reports
Below there are two examples of reports, on the next side Resource report examples, you will find some more examples.
Example of column-based display of a daily calendar exception for a 1-hour meeting:
Below there is an example of a row/operation based display of a calendar exception for a daily 1-hour meeting:
Post your comment on this topic.