
Economy control with budget- and turnover overview
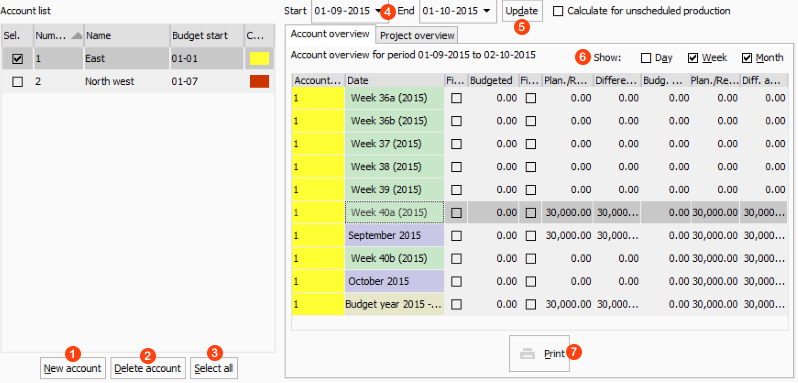
ROB-EX economy overview shows budgeted and planned turnover for a selected period. The overview is used to control if the turnover for the planned activities corresponds to the budgeted turnover. The budgeted turnover is entered for a given period, per day, per week or per month. The planned turnover is entered pr. operation in the Gantt charts detail panel and is shown summed up for a given period. The description of the economy overview refers to the example shown above.
 |
Create a new Account. An empty line is inserted in the Account list. Enter Account number, Account name and budget start. The budget start is used to define a budget year. For each budget year a sum is shown in the Budget list. Put a check mark in the Select field if the account should be shown in the budget list. The account is assigned to a project in the Edit project window, which is described above. Only the turnover from projects assigned to an account is shown in the budget list. The example shows 2 accounts in the account list to the left. |
 |
Mark the account in the account list and press the “Delete account” button. |
 |
Select all accounts and show them in the budget list. |
 |
The period for the economy view is set by selecting the start- and end date in the field Start and End. After a new period is selected use the update button to update the view. For each period ROB-EX Gantt calculates the planned turnover for all activities which are planned to end within the period. |
 |
Always press the Update button after start- or end time has been changed. |
 |
The detail level is selected using the boxes Week, Month or Year. In the example the period 1st. of February until 31st. of December is selected. Week and month view is selected. Weeks are represented by week numbers. Weeks splitted over two month are added the letters a and b. |
 |
Select the period in the Start and End fields. Select the detail level using the check marks for Day, Week or Month. Print the report by pressing the Print button. |
Account overview
Shows budgeted and planned turnover.
Account number
Shows which account the row belongs to. The account is activated in the Account list.
Date
Shows the period for the data in the row. The period can be day, week, month or year.
Budgeted
The budgeted turnover is entered pr. day, week or month. Put a check mark in the field Fixed to left of the Budgeted field and enter the value in the Budgeted field.
Planned/Realized
The planned turnover pr. operation is entered in the field “Turnover” to the right in the detail panel of the Gantt plan for every operation.
Each operation belongs to a production order. Each production order belongs to a project and one or more projects belongs to an account.
ROB-EX Gantt calculates the total turnover for a period selected in the account overview, e.g. a week, month or year. An turnover of an operation is counted on the time period where the operation ends, e.g. an operation starting in May and ending in June will be added to turnover of June.
The value Planned/Realized can be overwritten by the user by putting a check mark in the field Fixed to the left of the Planned/Realized column and then enter a value in the Planned/Realized field.
Difference
The difference between the budgeted and Planned/Realized turnover is shown in this column. Is the Planned/Realized turnover less than the budgeted turnover the difference is negative.
Budgeted accumulated
Accumulation of the budgeted turnover.
Planned/Realized accumulated
Accumulation of the Planned/Realized turnover.
Difference accumulated
Accumulation of the difference between the budgeted and Planned/Realized turnover.
Project overview
Overview of the projects for a selected period.
Open the project overview by
- Selecting the tap Project overview and select the period in the fields Start and End.
- Double click on a period in the Account overview.
The Project overview shows operations which ends in the selected period.
Project
Shows the name of the project
Production order
Shows
- The number of the production order which the operation belongs to
- The operation type
- The planned end time of the operation
Find the operation in the Gantt plan by double clicking on an operation in the table. The Project overview is closed and the operations are marked in the Gantt plan.
Value
Shows the turnover for the operation.
The total turnover is shown in the bottom of the table.
Post your comment on this topic.