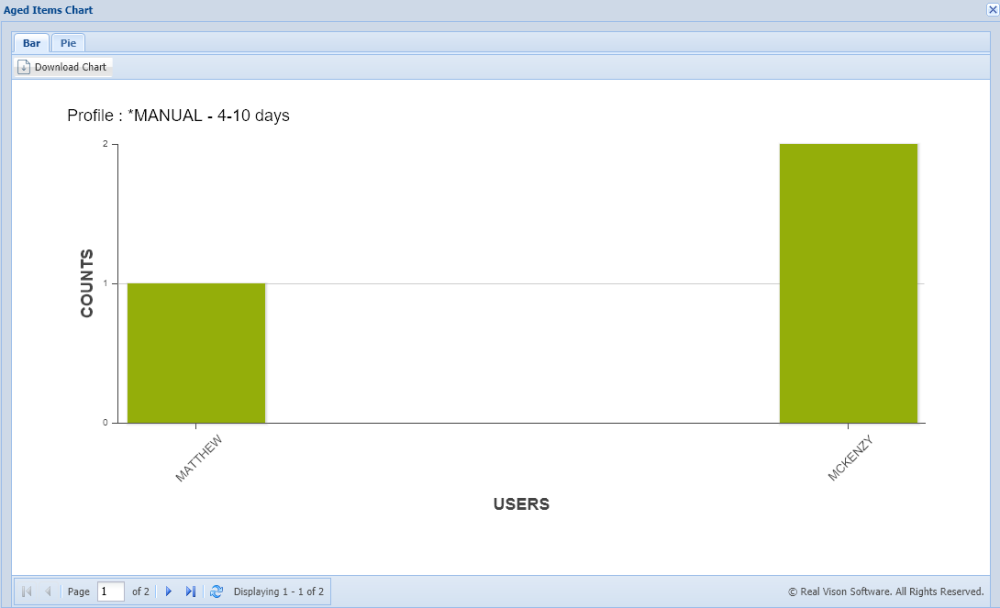
The Aged Items Chart is a visual representation (Bar or Pie format) of all the items sitting in a basket or routing profile for a number of days. The first display of the chart portrays a clean column chart designed to show quantities of items in the routing profile. The Y-axis describes the counts or quantity of items in the routing profile. The X-axis illustrates the name of the user in the route associated with the counts.
 |
All Items are classified into five categories:
- 1 – 3 Days Old
- 4 – 10 Days Old
- 11 – 20 Days Old
- 21 – 30 Days Old
- 30 + Days Old
 |
At the top left-hand corner of the chart area, it is easy to find the name of the profile and the category in which the item is sitting in the system.
All of the titles are updated automatically and each item is placed into its proper category respectively.
Another feature found in the chart’s window is the paging toolbar, located at the bottom left-hand corner of the window. The Paging toolbar handles navigating between each of the categories.
In the top left-hand corner underneath the tabs; a download button is available. The user can save the desired image to the local storage, generally saved to the Downloads folder of the local system unless specified otherwise.


Post your comment on this topic.