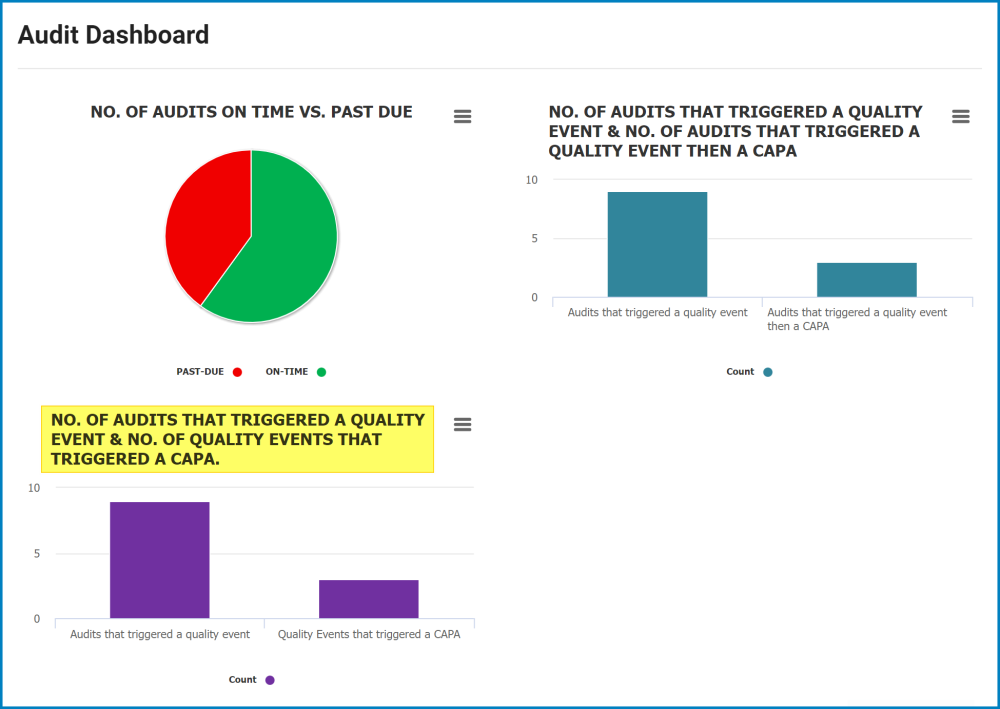
We have made improvements to the Audit Dashboard with the aim of providing a more intuitive and interactive user experience.
Key Changes:
# Filter Panel
We have added a filter panel to the dashboard, offering users an efficient means to tailor their data.
Location: Users can filter data by geographic location, selecting a region, country, and site.
Business Division: Users can filter data by business division or parent department.
Business Line: Users can filter data by a business line or child department associated with the selected business division.
When a filter is applied, the charts in the dashboard will dynamically update to display data specific to the selected criteria.
p(banner tip). Users can apply multiple filters simultaneously, customizing their data view according to their individual needs.
#_ Drilldown Functionality
To align it with the existing capabilities of the other two charts, we have added a drilldown functionality to the third chart in the Dashboard. This enhancement enables users to interactively explore detailed information within the chart, allowing for seamless navigation across different levels of data.
*To trigger the drilldown functionality for this chart, simply double-click on any of the bars in the bar chart.

Post your comment on this topic.