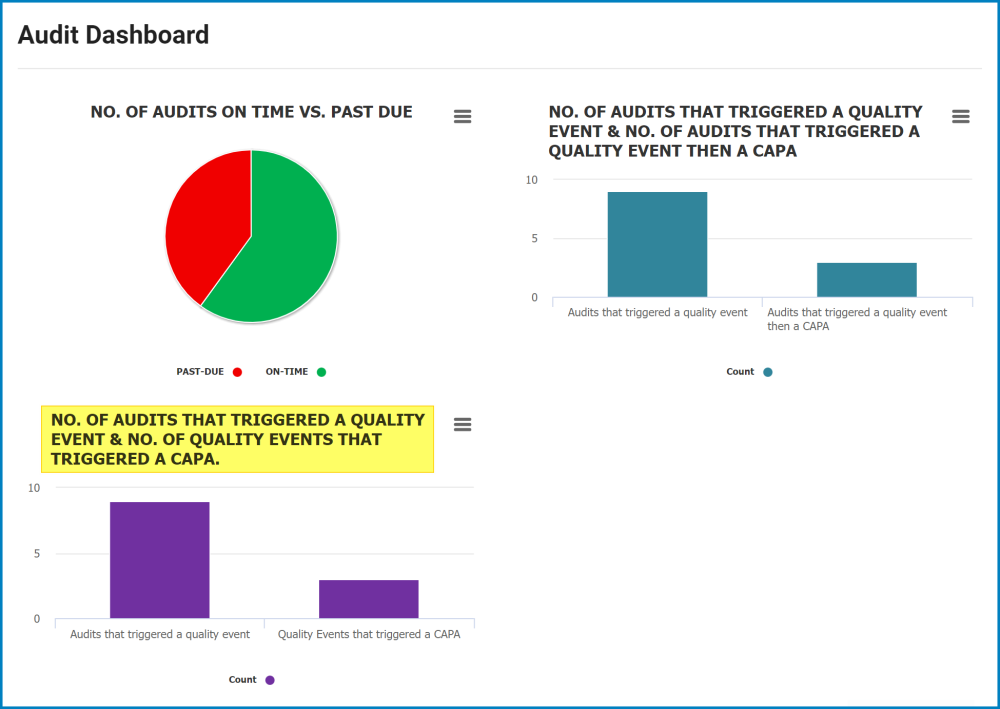
We have made improvements to the Audit Dashboard with the aim of providing a more intuitive and interactive user experience.
Key Changes:
# Filter Panel
We have added a filter panel to the dashboard, offering users an efficient means to tailor their data.
Location: Users can filter data by geographic location, selecting a region, country, and site.
Business Division: Users can filter data by business division or parent department.
Business Line: Users can filter data by a business line or child department associated with the selected business division.
When a filter is applied, the charts in the dashboard will dynamically update to display data specific to the selected criteria.
p(banner tip). Users can apply multiple filters simultaneously, customizing their data view according to their individual needs.
#_ Drilldown Functionality
Pour l’aligner sur les fonctionnalités existantes des deux autres graphiques, nous avons ajouté une fonctionnalité d’exploration au troisième graphique du Tableau de bord. Cette amélioration permet aux utilisateurs d’explorer de manière interactive des informations détaillées dans le graphique, permettant une navigation transparente entre différents niveaux de données.
*Pour déclencher la fonctionnalité d’analyse détaillée de ce graphique, double-cliquez simplement sur l’une des barres du graphique à barres.


Laissez votre avis sur ce sujet.