Instantaneous Heart Rate Graph
The red signal is the instantaneous heart rate over time. In the graph below, you can observe that the heart rate of this patient is approximately 60 beats per minute, but there is a rhythmic variability to the instantaneous heart rate.
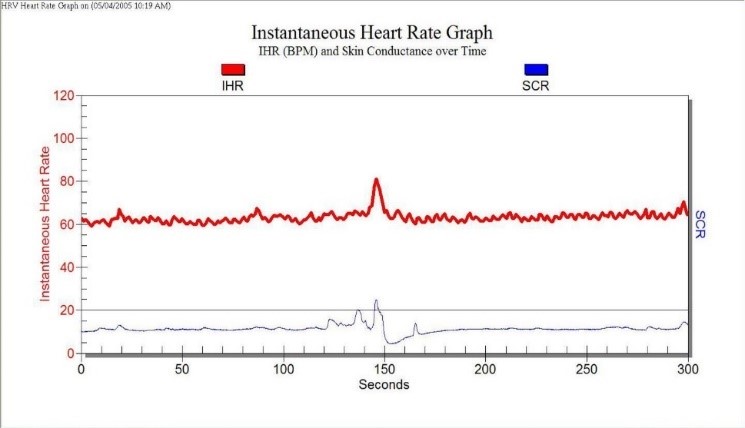
The blue signal is the Galvanic Skin Resistance. In the graph below, you can observe that the patient’s autonomic nervous system was stable, except for an arousal that occurred approximately 150 seconds into the protocol.
Autonomic Activity Diagram
This view quantifies the instantaneous heart rate graph. The graph presents two pieces of information:
- Overall autonomic activity level.
- Degree of balance between the sympathetic and parasympathetic branches.
The graph consists of a target zone for overall activity and balance, and places a white square as to the results of the patient’s five-minute assessment.
This graphic directly displays autonomic activity and autonomic balance. The autonomic activity is presented on the Vertical Axis (Y) and the balance on the Horizontal Axis (X). An example of this scan view is directly below.
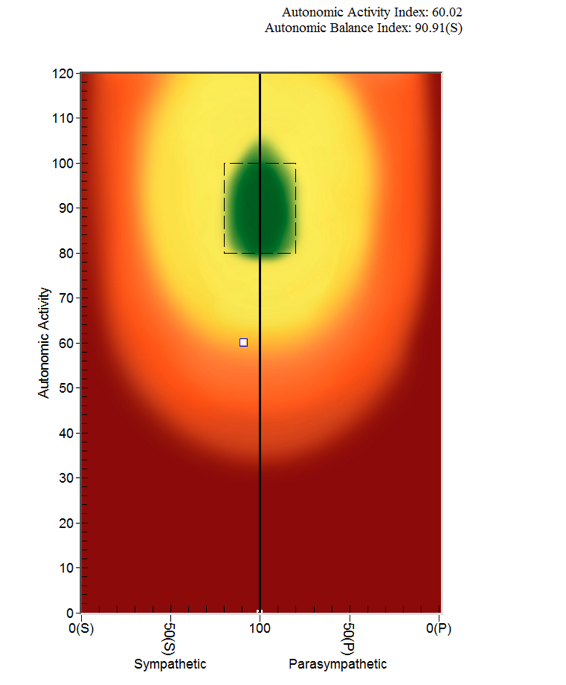
In addition, there are two statistics provided:
- Autonomic Activity Index A – Score of 100 indicates an idealized amount of autonomic activity or tone. Scores below 100 indicate less tone and scores above 100 indicate greater tone
- Autonomic Balance Indicator – (S) or a (P) to indicate the dominant branch. S corresponds to sympathetic and P to parasympathetic.
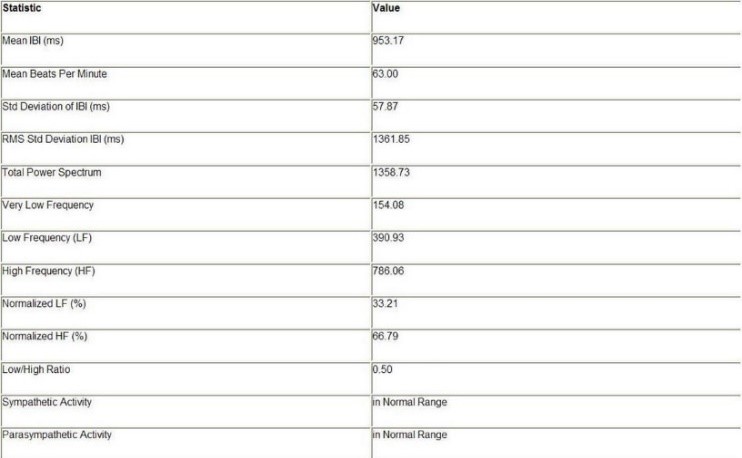
- Table View – Included are statistics regarding the average heart rate, as well as quantifications of the variability of that heart rate in both the time and frequency domains.