
Levels gives you detailed information about the channel composition of the layer through the use of a Histogram Display.This allows you to make manual adjustments to the tonality of the layer to improve its appearance. A Histogram is a graph which allows you to quickly see at a glance the exact range of tonal values in your image. Histograms are also available in the scopes panel, and more information about histograms is available in Introducing Scopes. The histogram is a more accurate way to assess colors than by eye.
The histogram displays a readout of the tones in your image. The tones range from pure black on the left to pure white on the right. The height of the graph at any point indicates the relative frequency of that specific tone in the image. Information for different channels of your image can be viewed, based on your selection in the Channels menu.
Channels Menu
- RBG: Displays three separate histograms at once, one for each color channel of your image. Each histogram is colored to match the channel it represents.
- RGB Combined: Averages the values of all three channels, and displays a single histogram that represents the overall tonal values of the image.
- Red: Displays the tonal values of the Red channel of the image.
- Green: Displays the tonal values of the Green channel of the image.
- Blue: Displays the tonal values of the Blue channel of the image.
- Alpha: Displays the tonal values of the Alpha channel of the image.
The Histogram
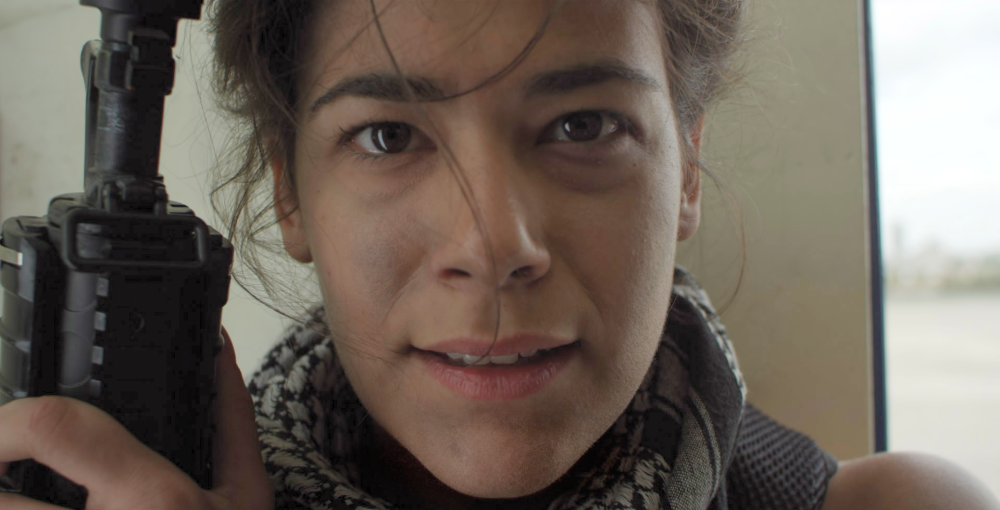
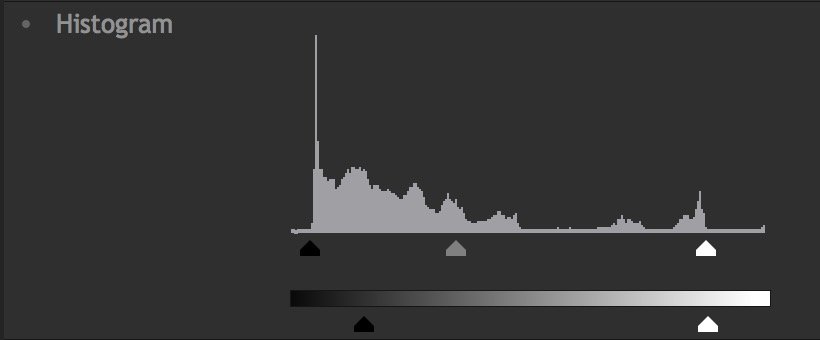
The primary method for viewing the levels in your image is the Histogram. The image below is represented by the histogram shown to its right.

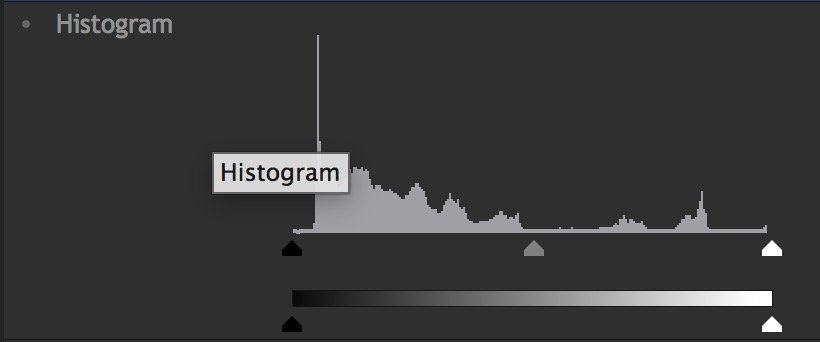
The histogram contains a Graph and a Gradient. Beneath the graph are three triangles, representing the Input Black (black triangle), the Gamma (grey triangle) and the Input White (white triangle). Looking at this histogram, notice that the graph does not begin at the Input Black, it ends before the Input White, and nearly all the image data is positioned below the mid-point Gamma control. By default, pure black is set to 0.0, and pure white is set to 1.0. Shifting the white or black input values evenly redistributes the tonal range of the image between black and white. However, adjusting them too far can result in clipping of the image, and loss of detail in the shadow or highlight areas.
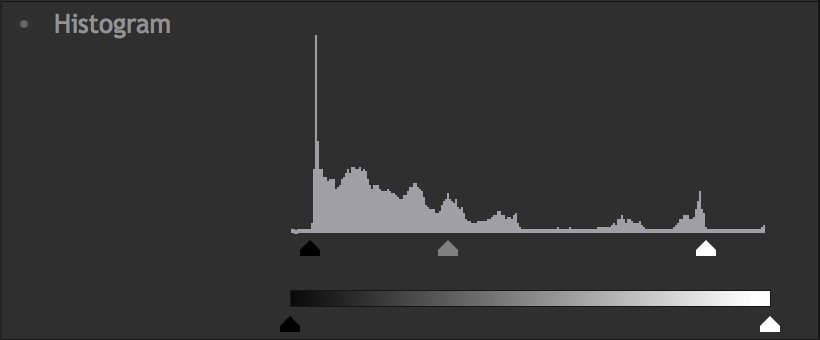
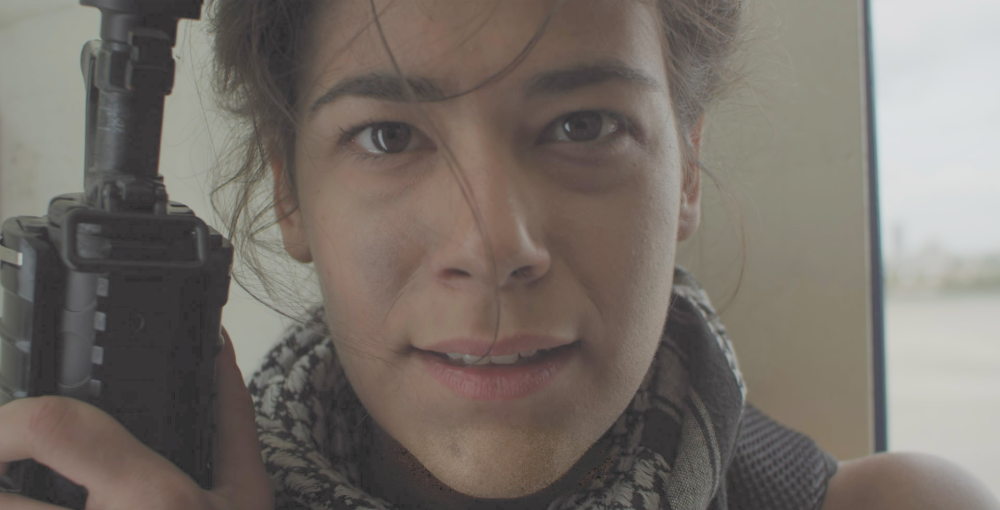
By adjusting these controls we can optimize the dynamic range of tones in our image. Slide the Input Black control to the right control until it touches the edge of the visible graph. Then, slide the White Input to the left, until it touches the edge of the visible graph. Shifting the Gamma will then redistribute the midtones between the white and black points. The image below shows how this basic adjustment can improve the image by darkening the blacks to true black, raising the highlights to pure white, and brightening the overall image with a Gamma shift.
There are also two triangle controls below the gradient, representing the Output Black (black triangle) and Output White (white triangle). Shifting these will reduce the contrast in the image, by reducing the intensity of the black point or white point of the image. This can be useful for creating a flat image in preparation for applying final grading adjustments. The image below shows how adjusting the Output Black and Output white affects our result.
Controls
- Input Black: Sets pure black in the image to the selected value. Any tones below the selected value will be clipped to pure black. Linked to the black triangle below the graph.
- Input White: Sets pure white in the image to the selected value. Any tones above the selected value will be clipped to pure white. Linked to the white triangle below the graph.
- Gamma: Redistributes the midtones between the defined input black and input white. Adjusting Gamma to the left will brighten the midtones, and adjusting it right will darken the midtones. Linked to the grey triangle below the graph.
- Output Black: Offsets the black point from 0.0 to the selected value.This is useful for lightening shadow areas of the image. Linked to the black triangle below the gradient.
- Output White: Offsets the white point of the image from 1.0 to the selected value. This can be beneficial for reducing the brightness of the highlights in your image. Linked to the white triangle below the gradient.