
Curves is a powerful color correction and grading tool, based on an editable graph. Here’s an example of the curves graph as shown in the Controls panel:
The horizontal axis on the graph represents the input, which is the original image. The vertical axis represents the output, which is the graded result. Therefore if you follow a line vertically up from any point on the graph until you hit the curves, then track to the left, you can see how the input is being changed.
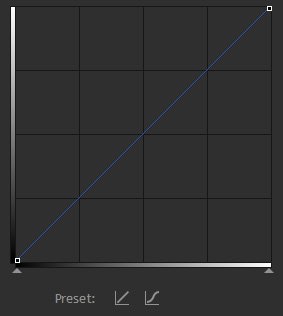
Therefore with the default curves graph you can see that the input values are identical to the output values:
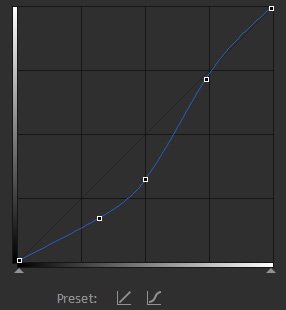
Two easy presets are provided, one of which resets the graph to the default straight line and another which creates an s-curve:
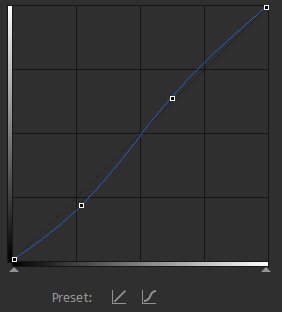
Where the graph becomes steeper you will see increased contrast, whereas a shallower incline will reduce contrast. In the case of an s-curve, the center of the graph is steeper, which increases contrast in the mid-tones, at the expense of detail in the shadows and highlights.
Given that the focus of a frame is often in the mid-tones (such as actor’s faces), an s-curve is often an effective way to add perceived detail and contrast to a shot.
Curves can be used to adjust the RGB channels combined or each channel individually. Adjusting individual channels can be useful for correcting white balance and lighting issues.
Interface Size
The curves graph can be displayed at two sizes, depending on the precision you need and your personal preference.
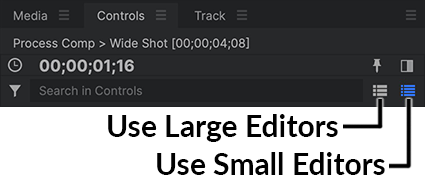
The Use Large Editors and Use Small Editors buttons are found near the top of the Controls panel Click either button to choose the size used for the Curves graph.