
In HitFilm, animation refers to anything that changes over time, not just to movement. For example, this could refer to changing a layer’s transparency over time, having its color shift from blue to red over time, or increasing the number of particles created each second.
By default, changing a property will change it for the duration of the layer. Moving a layer to the right, for example, will cause it to remain in that new position for its entire duration. If you want a property to change over time – for example, having a layer move from left to right over five seconds – you do so using keyframes.
Your timelines are built up from multiple frames. A keyframe is a special frame which stores additional information about a change to a property value. Keyframes are turned off for all properties by default. To turn keyframing on for a property simply click the grey circle to the left of the property name. For more information on using keyframes see Animating with Keyframes.
Keyframes
All properties have temporal animation. This is animation which happens over time. By adjusting the temporal interpolation you can alter the speed at which animation plays out.
The default timeline view shows all your keyframes. Each property has its own row on the timeline and keyframes are displayed here as grey icons. Here’s an example showing keyframes for a layer’s opacity and position properties:
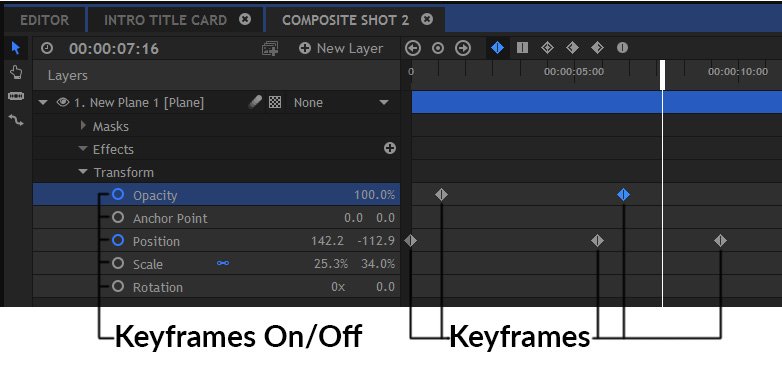
Note that this view makes it easy to see how keyframes relate to each other – in this case, I can see that the opacity of the layer changes while the layer moves position. However, there’s no way at a glance to see the value of each keyframe, without moving the playhead and checking the numerical display on the left, or observing the layer in the Viewer.
Value Graph
The value graph mode displays an alternate view. Here’s the same setup in value graph mode:
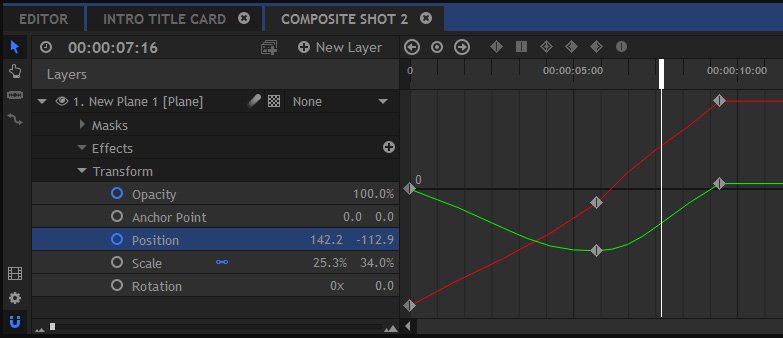
The value graph shows the details for the currently selected property. At a glance you can see how the value changes over time, without needing to move the playhead. In the case of the position property there are two lines plotted – one for the X position (red) and one for the Y position (green).
The graph here shows that the layer is moving from left to right while also dropping lower in frame before rising back up again. This information isn’t available in the default timeline view. The angle of the graph shows the speed of the value change. A steep angle shows a faster animation.
However, because the value graph can only display a single property at a time it can’t be used to directly compare multiple properties. If we wanted to see the opacity keyframes, we would have to first select it in the layer list.
See The Value Graph for full details.
Spatial Controls
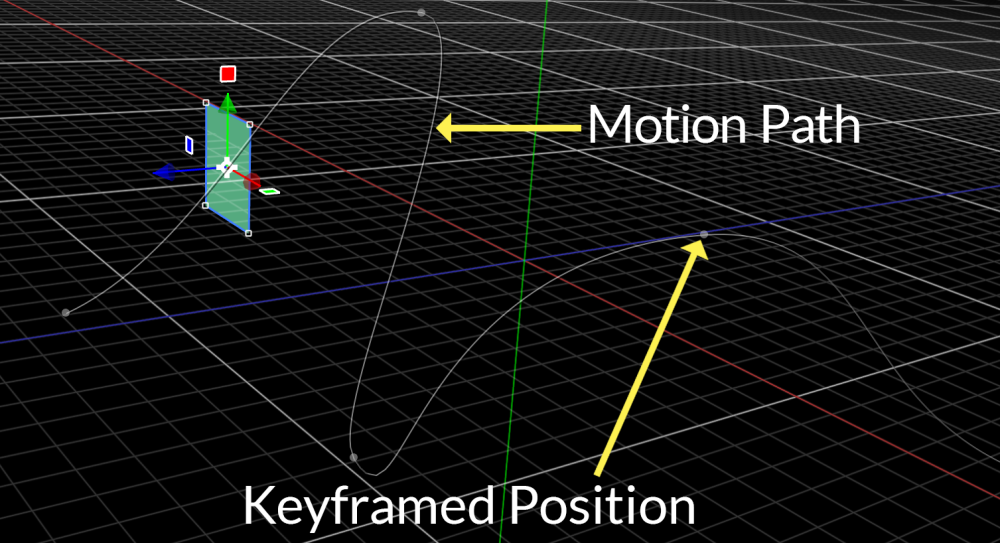
A layer’s position property has an additional spatial element. This is how the property changes in space, which is separate to how it changes over time.
The animation of a layer in space is displayed using a motion path. This is draw onto the Viewer and shows the path taken by the layer over time.
Full details can be found in the chapter Spatial Animation in the Viewer.