
Reports allow the end user to print interface information. Once the fields have been created and the layout adjustment has been made, it is now possible to create a report.
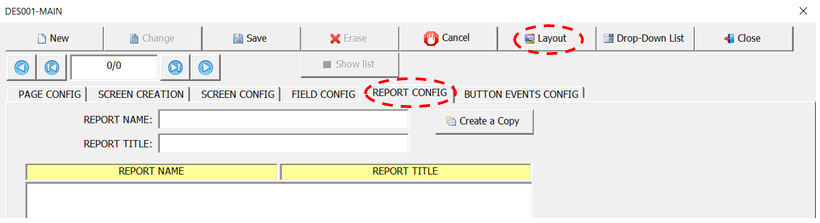
To create a report, access the (Report Config) tab, click on the (New) button and fill in the fields as shown in the figure below.

- Report Name: It is possible to create more than one report for the same interface, so the field (Report Name) helps to differentiate each report.
- Report Title: This field will be shown at the top of the report when printing it.
Ao clicar em (Save), será criada a estrutura do relatório baseado nas guias da interface bem como nos campos que existirem nessa interface.
Duplicate a report
You can make a copy of an already created report. A copy can be useful for saving a (backup) of the report before making any changes to an existing report.

Report layout adjustment
Once the report has been created, click the (Layout) button to adjust the report layout.
The figure below shows the tool for adjusting the report layout. The sections (Header and Details) will be created according to the number of interface tabs.

Let’s take the interface (Employee Registration) as an example. This interface has two tabs, one called (Employee) and another called (Dependents). The report structure created for this interface can be seen in the following figure.
We can see that two sections were created, one for printing Employee data and another for Dependent data.

As in the interface, each report field is formed by two basic objects (Label and Field). Objects (Label) have a dark gray background and are used to indicate the purpose of the field. The objects (Field) identified by the white color are used to show the data. Depending on the number of fields on each tab, these objects can be positioned in the sections in two ways.
- List format: In the example in the figure above, this was the format used to position the objects on the tab (Dependents). This format is used when the tab has few fields. Objects (Label) are placed in the section (Header) and objects (Field) are placed in the section (Details). This layout optimizes the amount of paper used for printing the data. The figure below shows an example of printing the list format.

- Default format: This format is used when the tab has many fields. Both objects (Label) and (Field) are positioned in the (Details) section. The arrangement of objects is based on the position of the fields in the interface. The figure below shows an example of printing the default format.

Save or discard changes
Once the desired changes have been made, click the (Save) button to save the changes. If you want to discard the changes, click on the (Cancel) button.

Hide Fields
The larger red rectangle represents the print area of the report. If any fields are placed outside this area, they will not be displayed in the report. To hide a field, move it to the left side of the red line, so that field will not be printed, thus reducing the amount of ink and paper needed to print the report. The figure below shows how to hide a field.

Insert a logo
To insert a logo in the report, click on the (Insert Logo) button. The logo must be positioned inside the section (Report Header), next to the report title as shown in the figure below. To erase a logo, click the (Erase Logo) button.
Erase Lines
To erase a row, select the row to be erased and then click (Erase row) as shown below.

Insert Lines
To insert a row, select the row where you want the new row to be inserted and then click (Insert row) as shown below.

Adjusting the size and position of objects
To adjust the size and position of an object, select it and move it to the desired position. Resize the object as desired as shown in the following figure.

Format the object font
It is possible to change some object font properties such as bold, italic, size and color as shown in the figure below.

Post your comment on this topic.