Intelligent Detection of Data Regions
Smart UI uses intelligent automation to scan the active worksheet and locate a consistent data region — without relying on fixed cell positions. Instead, it analyzes the layout to identify a structured table, usually formed by a header row followed by rows of related data.
This detection process considers patterns such as filled cells, alignment across columns, and the continuity of data. Once a suitable region is identified, the first row is interpreted as form field names, while the rows below define the records that populate the form.
To better understand how this logic works, consider the following example:

The range A1:E10 contains a data table. Row 1 holds the headers:
- A1: Id
- B1: Full Name
- C1: Date of Birth
- D1: Function
- E1: Note
The range A2:E10 contains the corresponding records.
Based on this structure, Smart UI recognizes A1:E1 as the header row and A2:E10 as the data region. Each form field will be named according to the values in the header row, and the form will automatically be filled with the matching records from the data range.
In the same worksheet, suppose there is a second table starting at G1:G7, where G1 is labeled Function, and G2:G7 contain options for a drop-down list. If column F is completely empty, Smart UI recognizes this new table as a separate reference list and excludes it from the data region. However, if that table were placed in column F, Smart UI would treat A1:F1 as the header row and include A2:F10 in the data region — potentially introducing unintended fields.
This smart detection mechanism makes Smart UI highly adaptable to different layouts, eliminating the need for manual configuration — and allowing you to generate professional forms with a single click, even in complex or irregular worksheets.
Best Practices for Using Smart UI
Simple tips to ensure smooth operation
To get the most out of Smart UI and avoid layout issues, it’s best to avoid merged cells in the following areas:
Column header row (first detected data row)
Smart UI begins scanning your sheet from cell A1, identifying the first contiguous block of non-empty cells to define the column headers. This is not necessarily the first row of the spreadsheet, but rather the first detected data row.
If any cells in this row are merged, Smart UI may not correctly recognize the content of those columns. This could result in fields being created with incorrect or missing titles in the data entry form.

Data region (rows below the header)
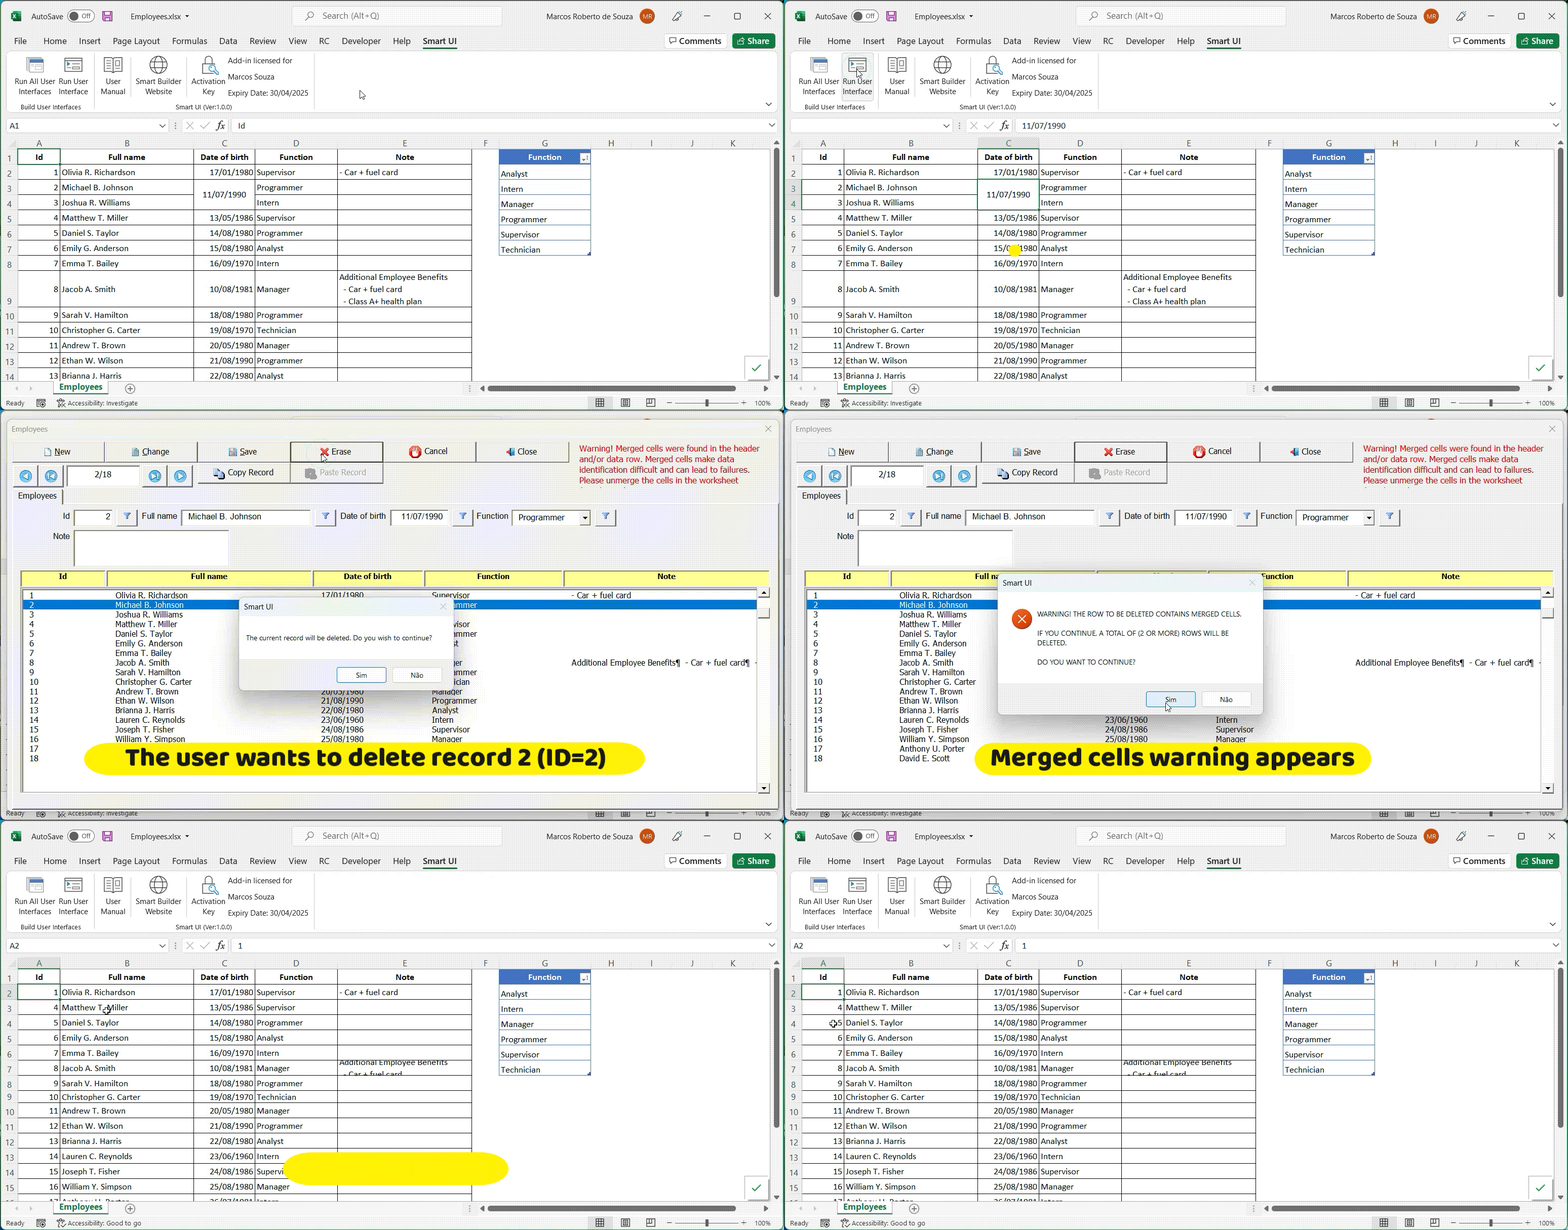
While Smart UI processes unmerged data normally, using merged cells in the data rows can lead to unexpected deletions — due to how Excel handles merged ranges.
For example:
If a cell is merged across two rows, and you delete one of those rows, Excel will automatically delete both rows involved in the merge. This is standard Excel behavior, not a bug in Smart UI, but it can lead to data loss if you’re not aware of it.

In the example below, cells C3:C4 are merged. When the user selects one of the records (ID = 2 or ID = 3) and clicks the (Erase) button, the interval A3: E4 will be erased.


Post your comment on this topic.