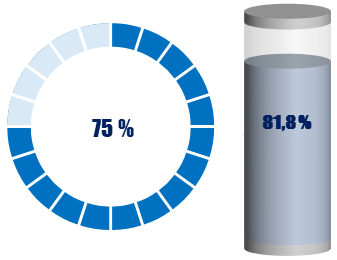
Indicators (Battery and Progress circle) display the progress made towards a given goal, allowing you to quickly monitor information in order to provide data for strategic decision making. These objects need two values to show the progress of a goal, they are:
- Max Value: Maximum target value, equivalent to 100%.
- Value: Value reached so far.
From these two values it is possible to display the actual performance compared to the maximum (target) value.

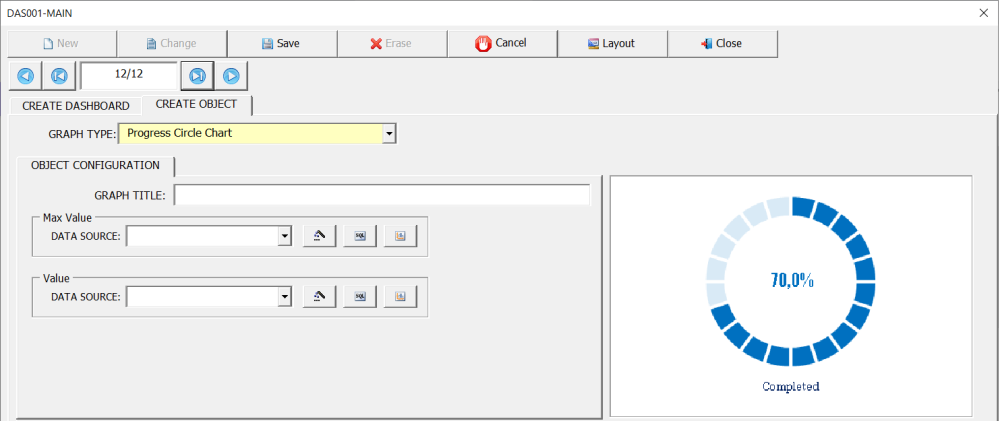
The following example uses the indicator (Progress cycle) to display the percentage of activities approved (Follow-up = Approve) within the deadline (Due Date <= Closing Date). The records were counted using the function (Count) and the field (Compl. No) which is the primary key of the table (D0/Plan).

The maximum value (Max Value) in this case is the total number of approved actions (Follow-up = Approve), regardless of whether it was closed within the deadline. Data filtering (Follow-up = Approve) was done through the data filtering wizard.

The value (Value) is the total number of approved actions (Follow-up = Approve) and that the closing date (Closing Date) is less than or equal to the due date (Due Date).

The DAS003-Axis selection screen is used to select, among the query fields, which one contains the value that will be used in the indicator. For indicators (Battery / Progress circle), only selection on the y-axis (Y-Axis) is allowed.

The figure below shows the complete example.


Post your comment on this topic.