A dashboard provides a quick view of key performance indicators (KPIs) relevant to a specific process. By providing this overview, process managers can save time and improve their decision making.
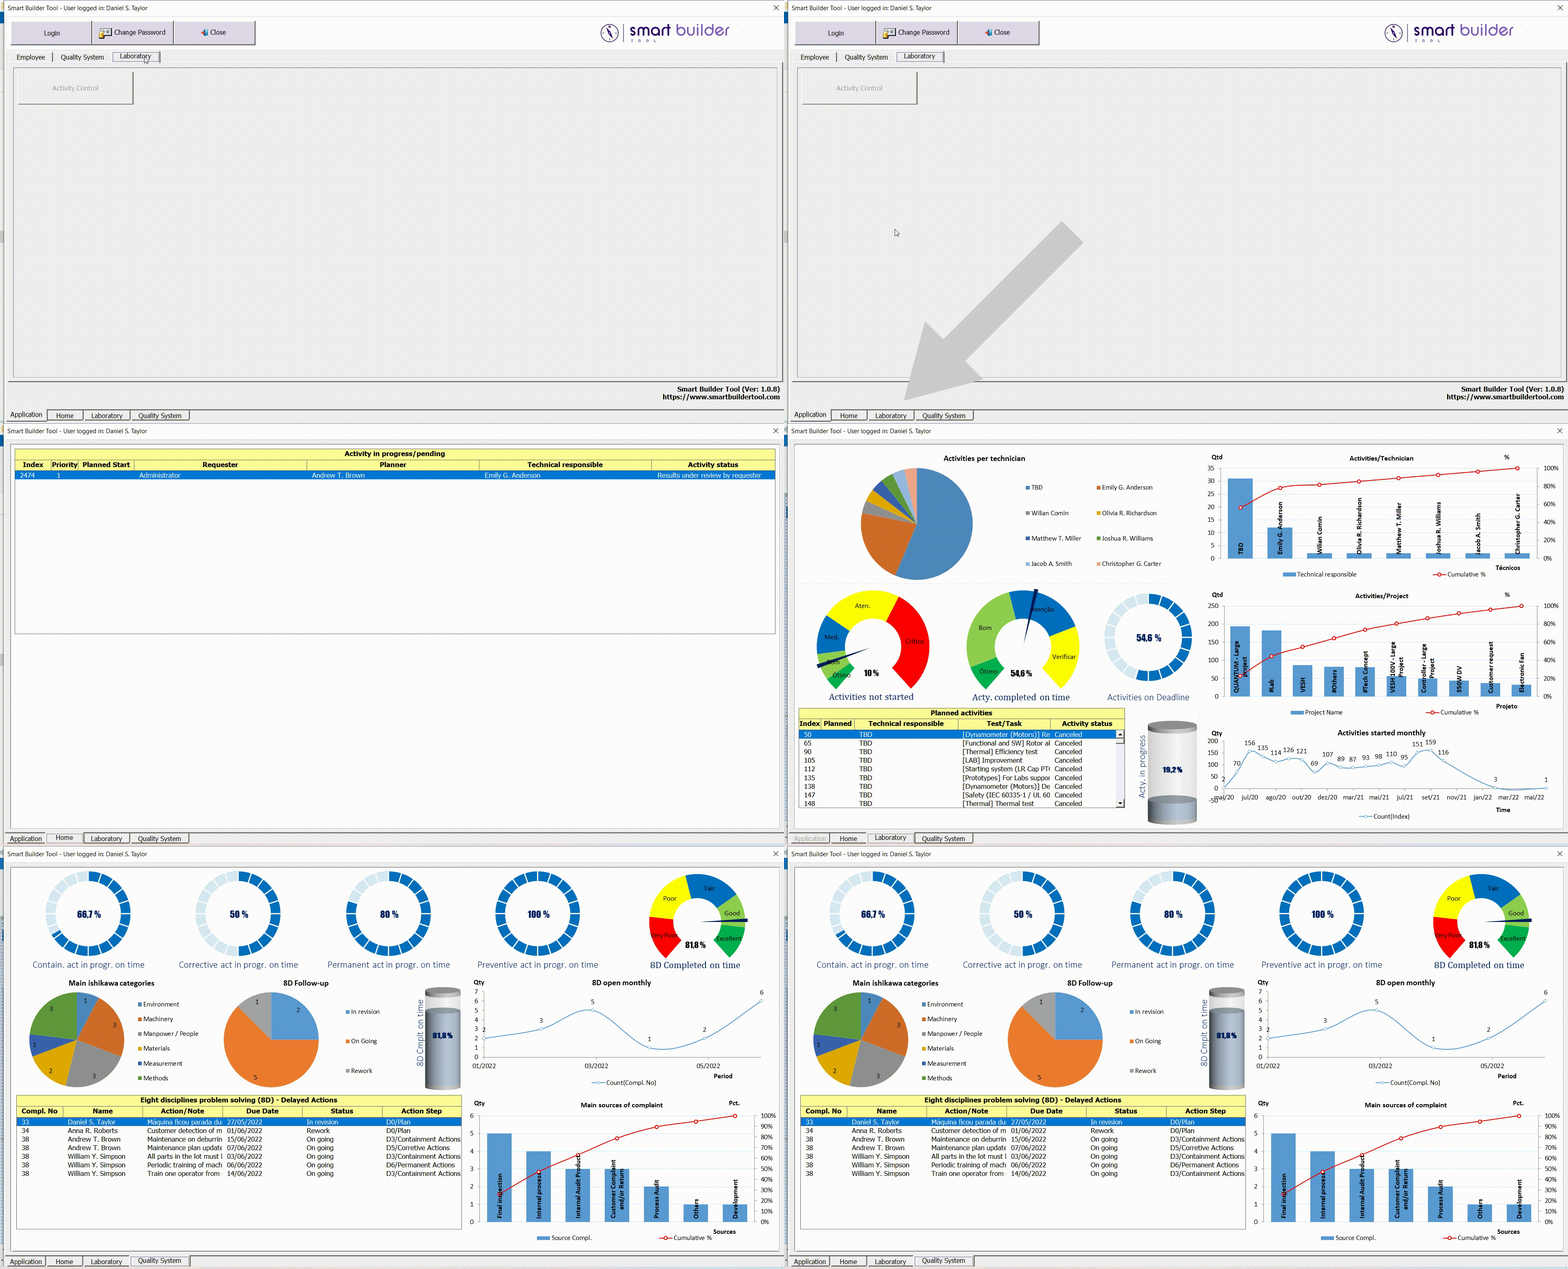
Organizing dashboards into tabs
The tabs are intended to organize the dashboards in order to concentrate all indicators (KPIs) with some type of correlation within the same tab. The tab name should give the app user an idea of the purpose of that dashboard. For example, a tab called (Quality) should focus indicators aimed at quality-related issues.
Dashboard creation tool
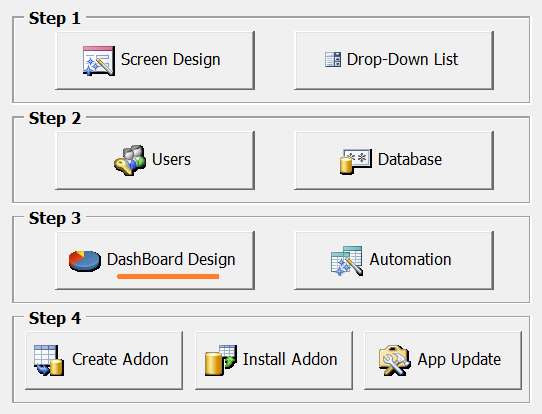
To access the dashboard creation tool, click on the (Dashboard Design) button located on the (Design Tools) tab.
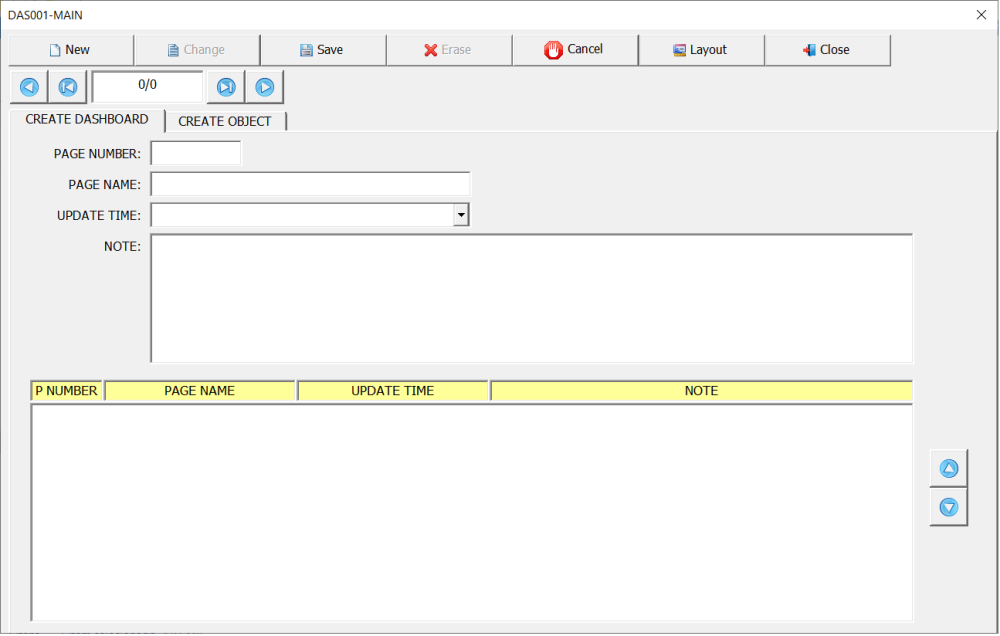
The following screen should be displayed.
Creating the tabs and setting the update time
The tab (Create Dashboard) is intended to create the tabs where objects (charts and tables) will appear in addition to defining the update time of these objects.
This tab has the following fields:
- Page Number: Automatic counter controlled by the application itself.
- Page Name: Name of the dashboard.
It is recommended to assign a short, more suggestive name. The dashboard name should give the user an idea of the process to which the indicators contained in that dashboard refer. - Update Time: Time in which the information contained in the dashboard will be updated.
For example, if you select (Update every 1 minute), every 1 minute all objects (charts and tables) contained in the dashboard will be updated. - Note: Field used for general comments (optional).
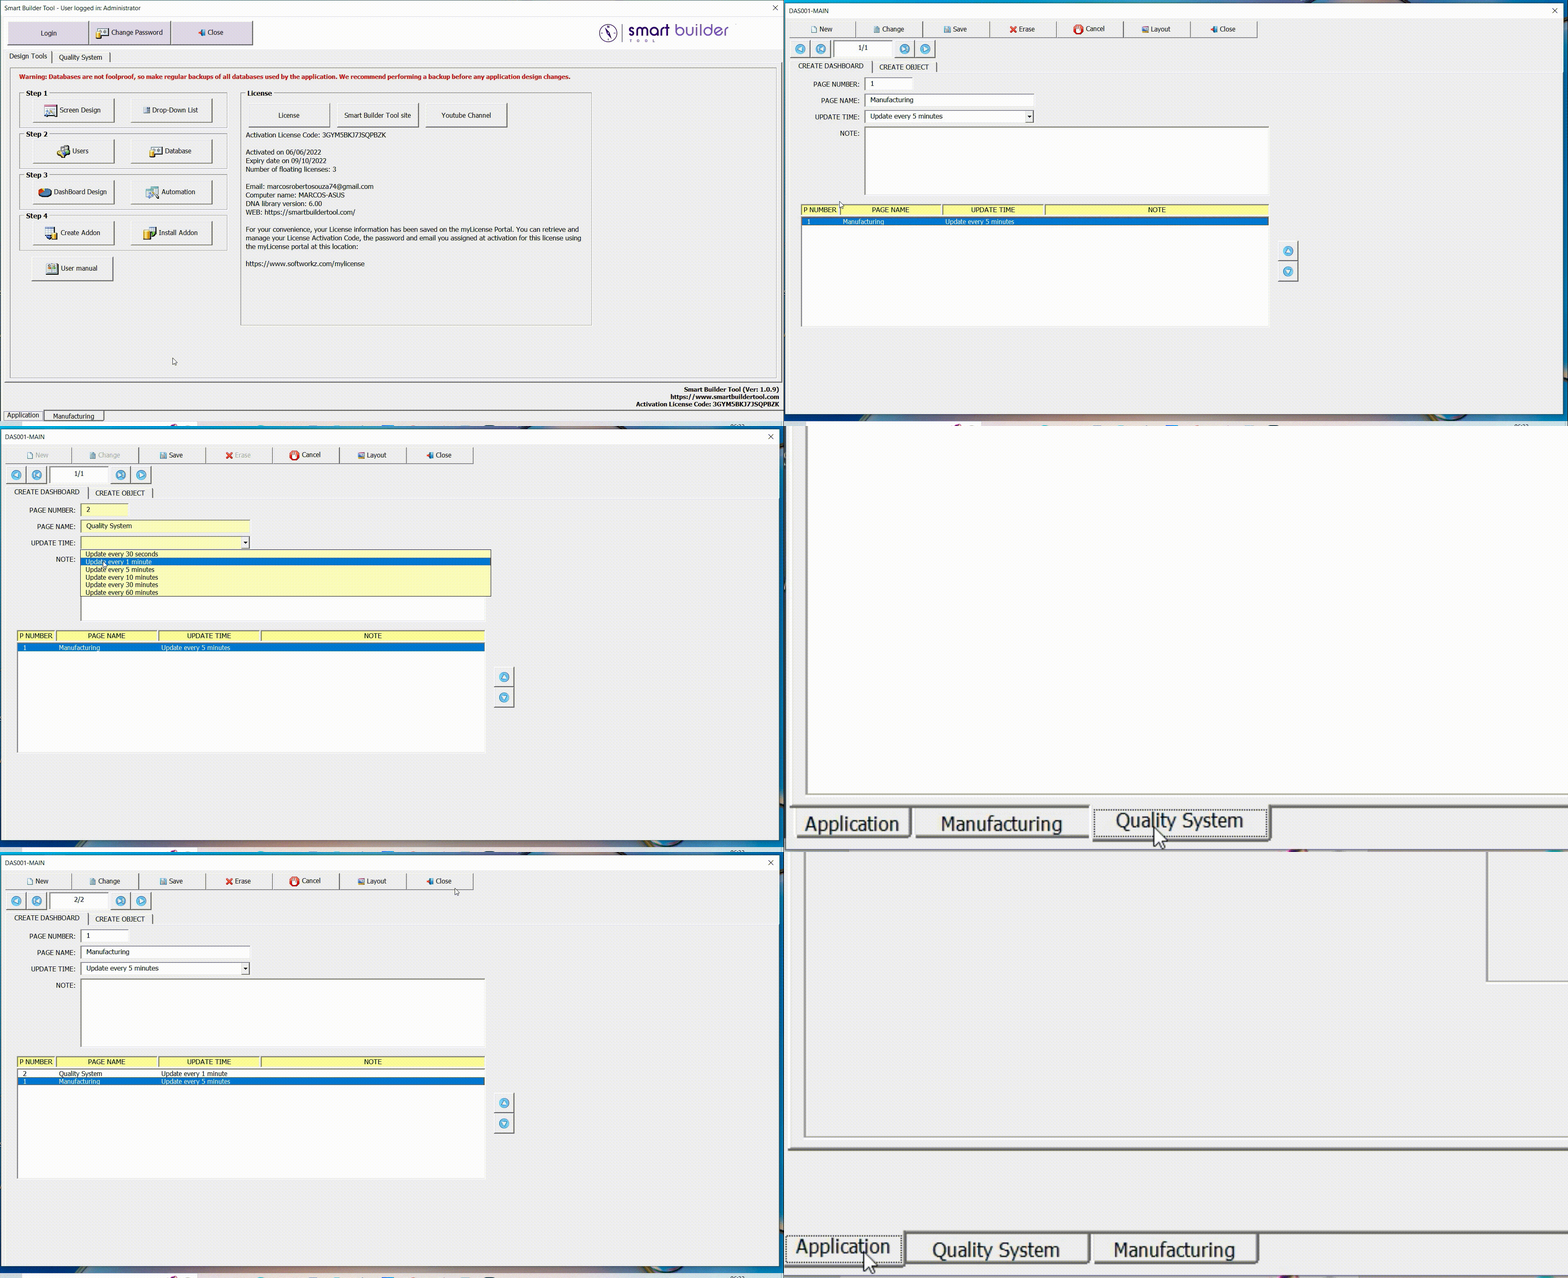
The figure below shows an example of creating dashboard tabs, as well as how to change their display sequence.
Types of existing indicators
The figure below shows an example of all existing indicators in the application.
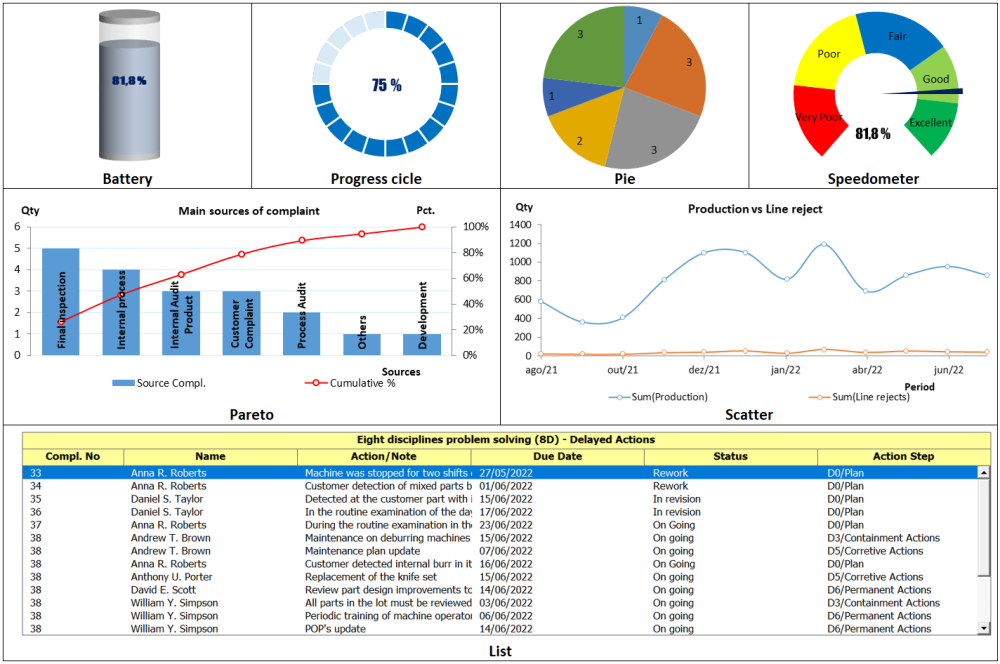
Adding a new indicator to the dashboard
Below is the procedure to add a new indicator to the dashboard.
- On the (Create dashboard) tab, select the dashboard to which the indicator will be added;
- Select the (Create Object) tab and click on the (New) button;
- Select the desired indicator type in the field (Graph Type);
- In the field (Graph Title / List Title) fill in the object’s title;
The other fields to be filled in depend on the selected object type (Graph Type).
H2. Data source of the indicators
Every indicator needs a data source to display the results. The data source can be of two types:
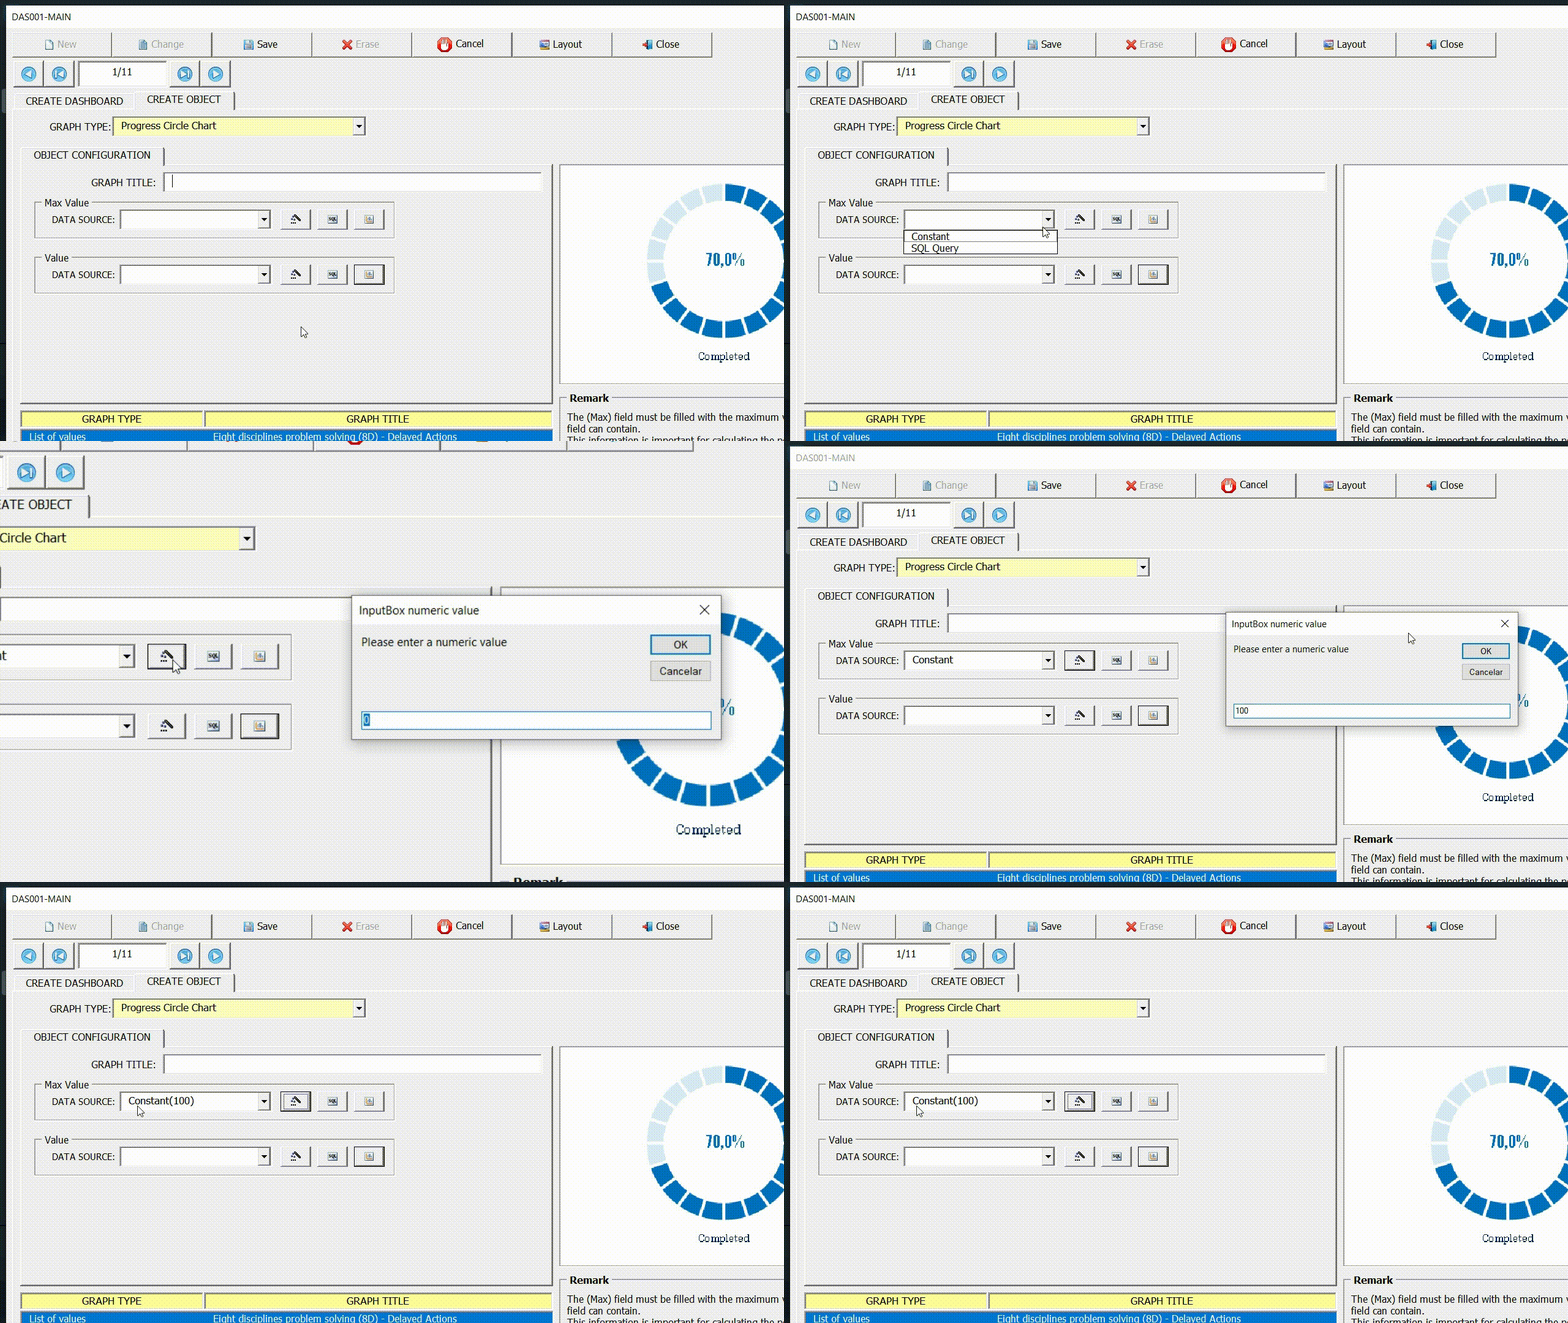
- Constant value
A constant value can only be applied to indicators (Battery, progress cycle and speedometer). Assuming that one of the values (Target or value) is a known fixed value, a constant can be applied in this case.

The example below shows how to select a constant value.
- Data coming from tables
Each tab of a user interface created in the application generates a table. The existing data in these tables can be displayed through indicators.

The example below shows the two tools for selecting data from tables.
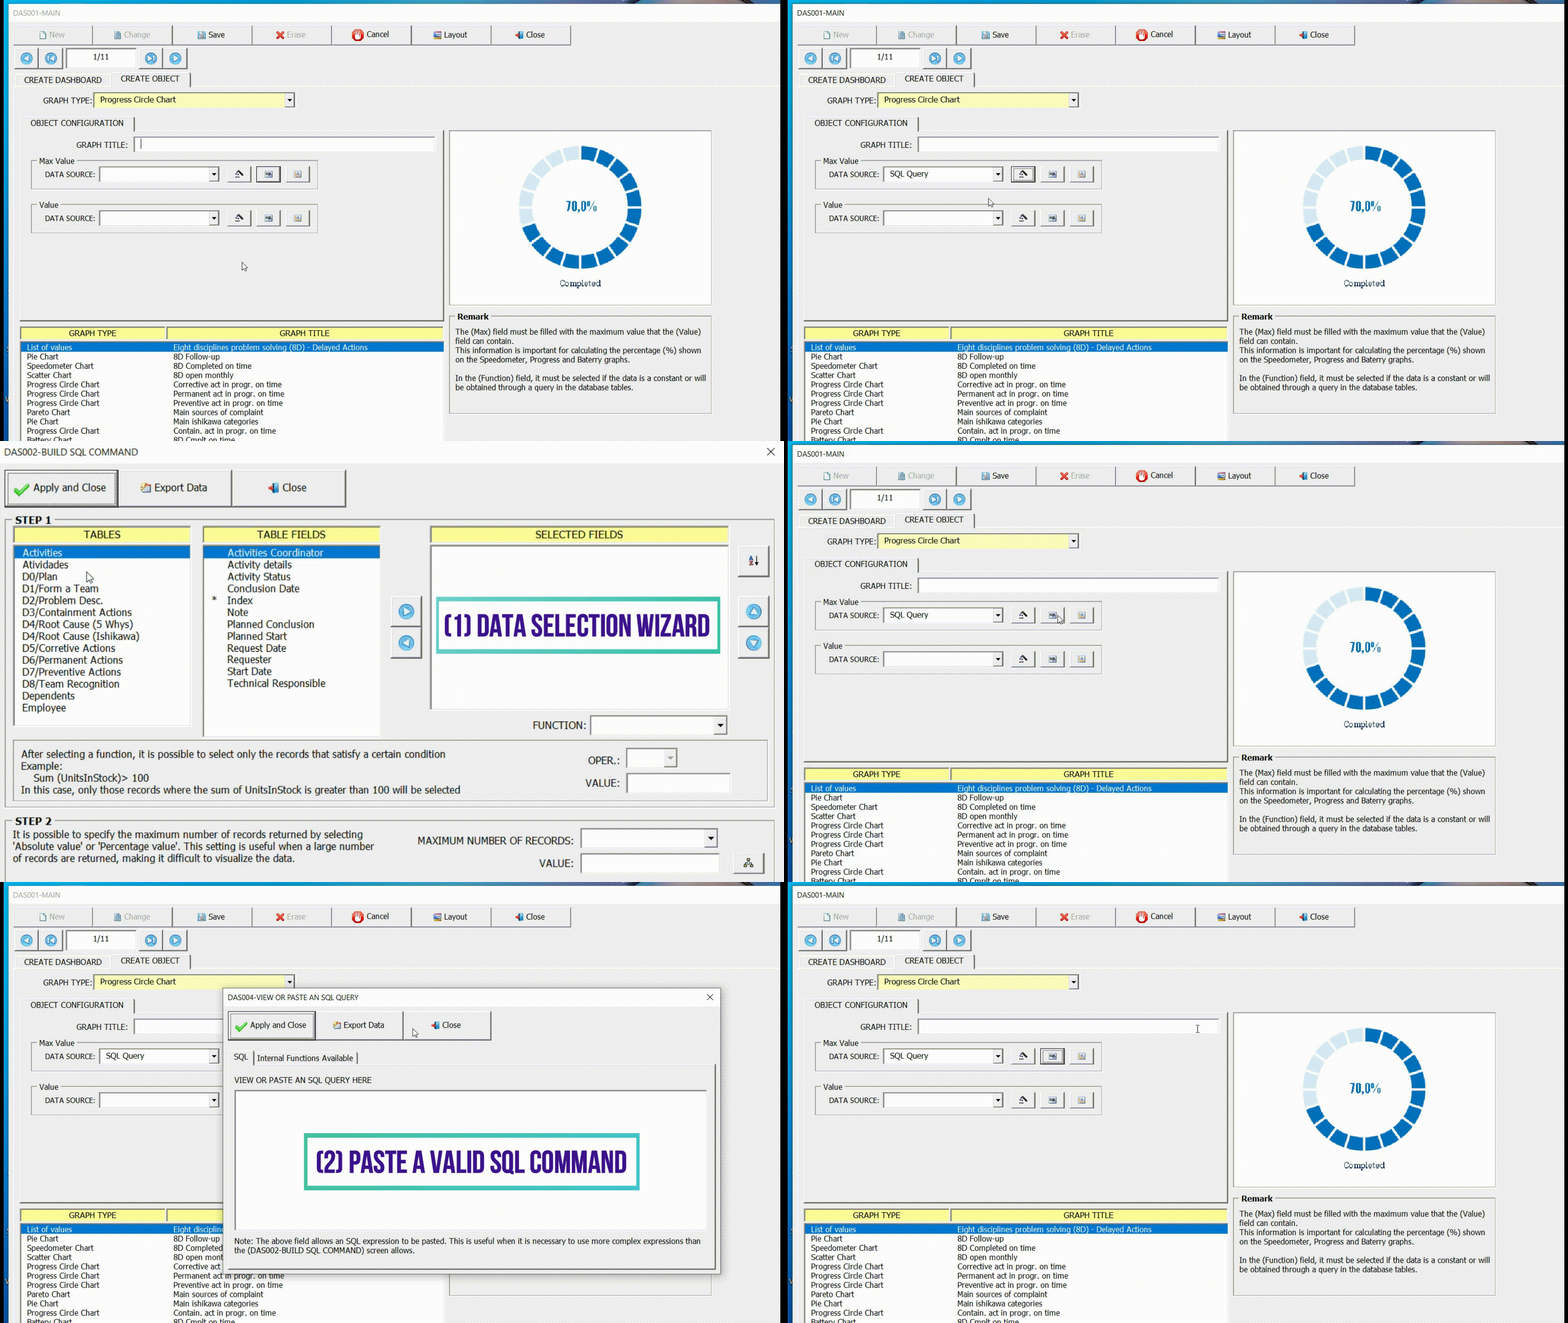
(1) Data selection wizard
The figure below shows the data selection wizard.
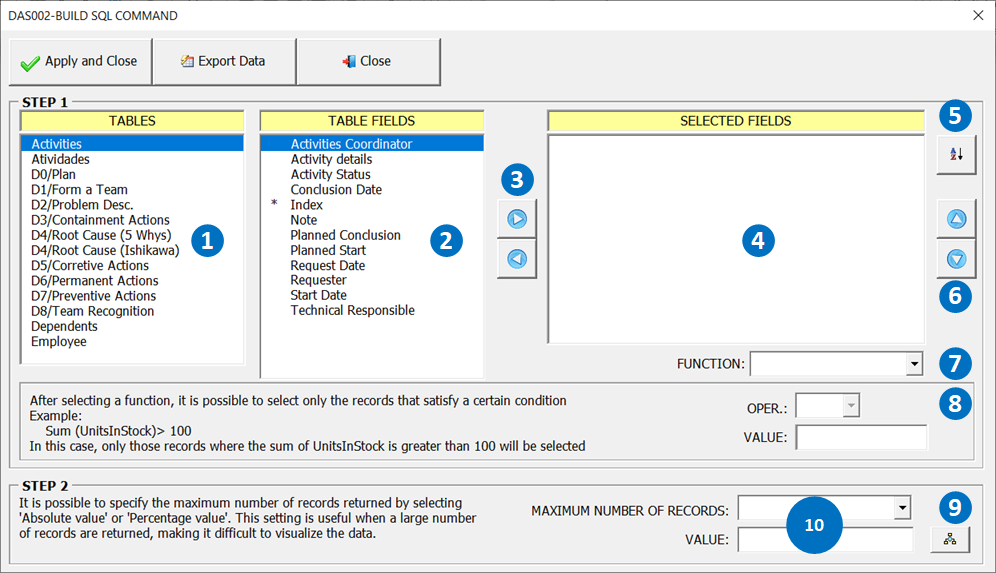
Below is a brief description of the main items of the wizard:
- List where all tables created in the application are displayed;
- List all fields according to the table selected in item (1);
- Used to move/remove selected fields in (2) to list (4);
- List with selected fields;
- Used to sort the fields selected in item (4);
- Used to move up/down selected fields in (4);
- List of functions according to the field selected in (4);
- TBD;
- Calls the data filtering wizard;
- Used to restrict the maximum number of query items.
Data Filtering Wizard
This wizard allows you to configure conditions for filtering the data. The image below shows the wizard screen.
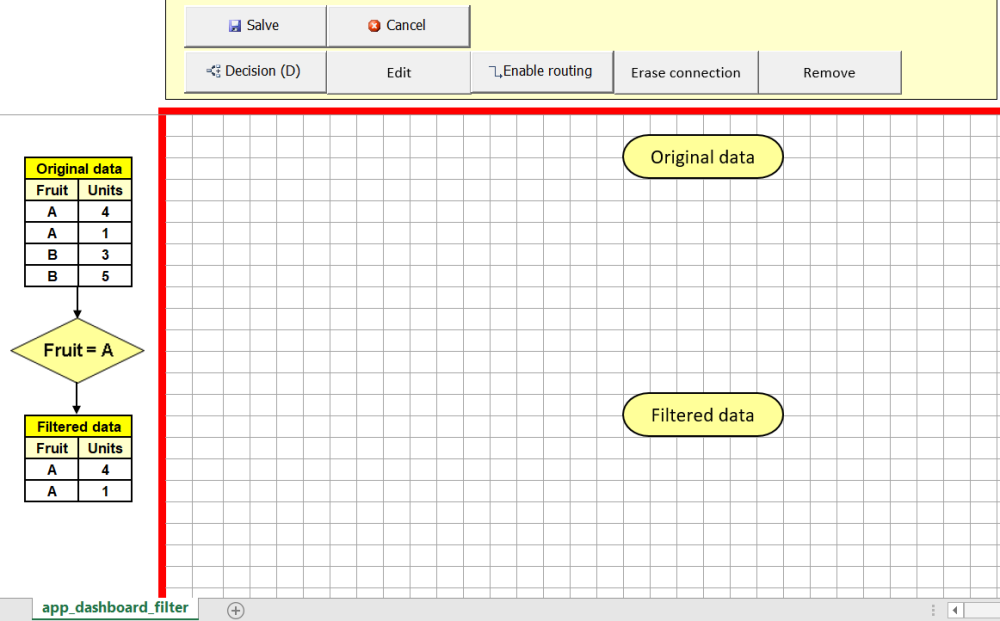
The object named (Original Data) represents (All) the query data. The object named (Filtered Data) represents the filtered data. Between these two objects you must configure the condition. The (Decision) button is used to configure these conditions.
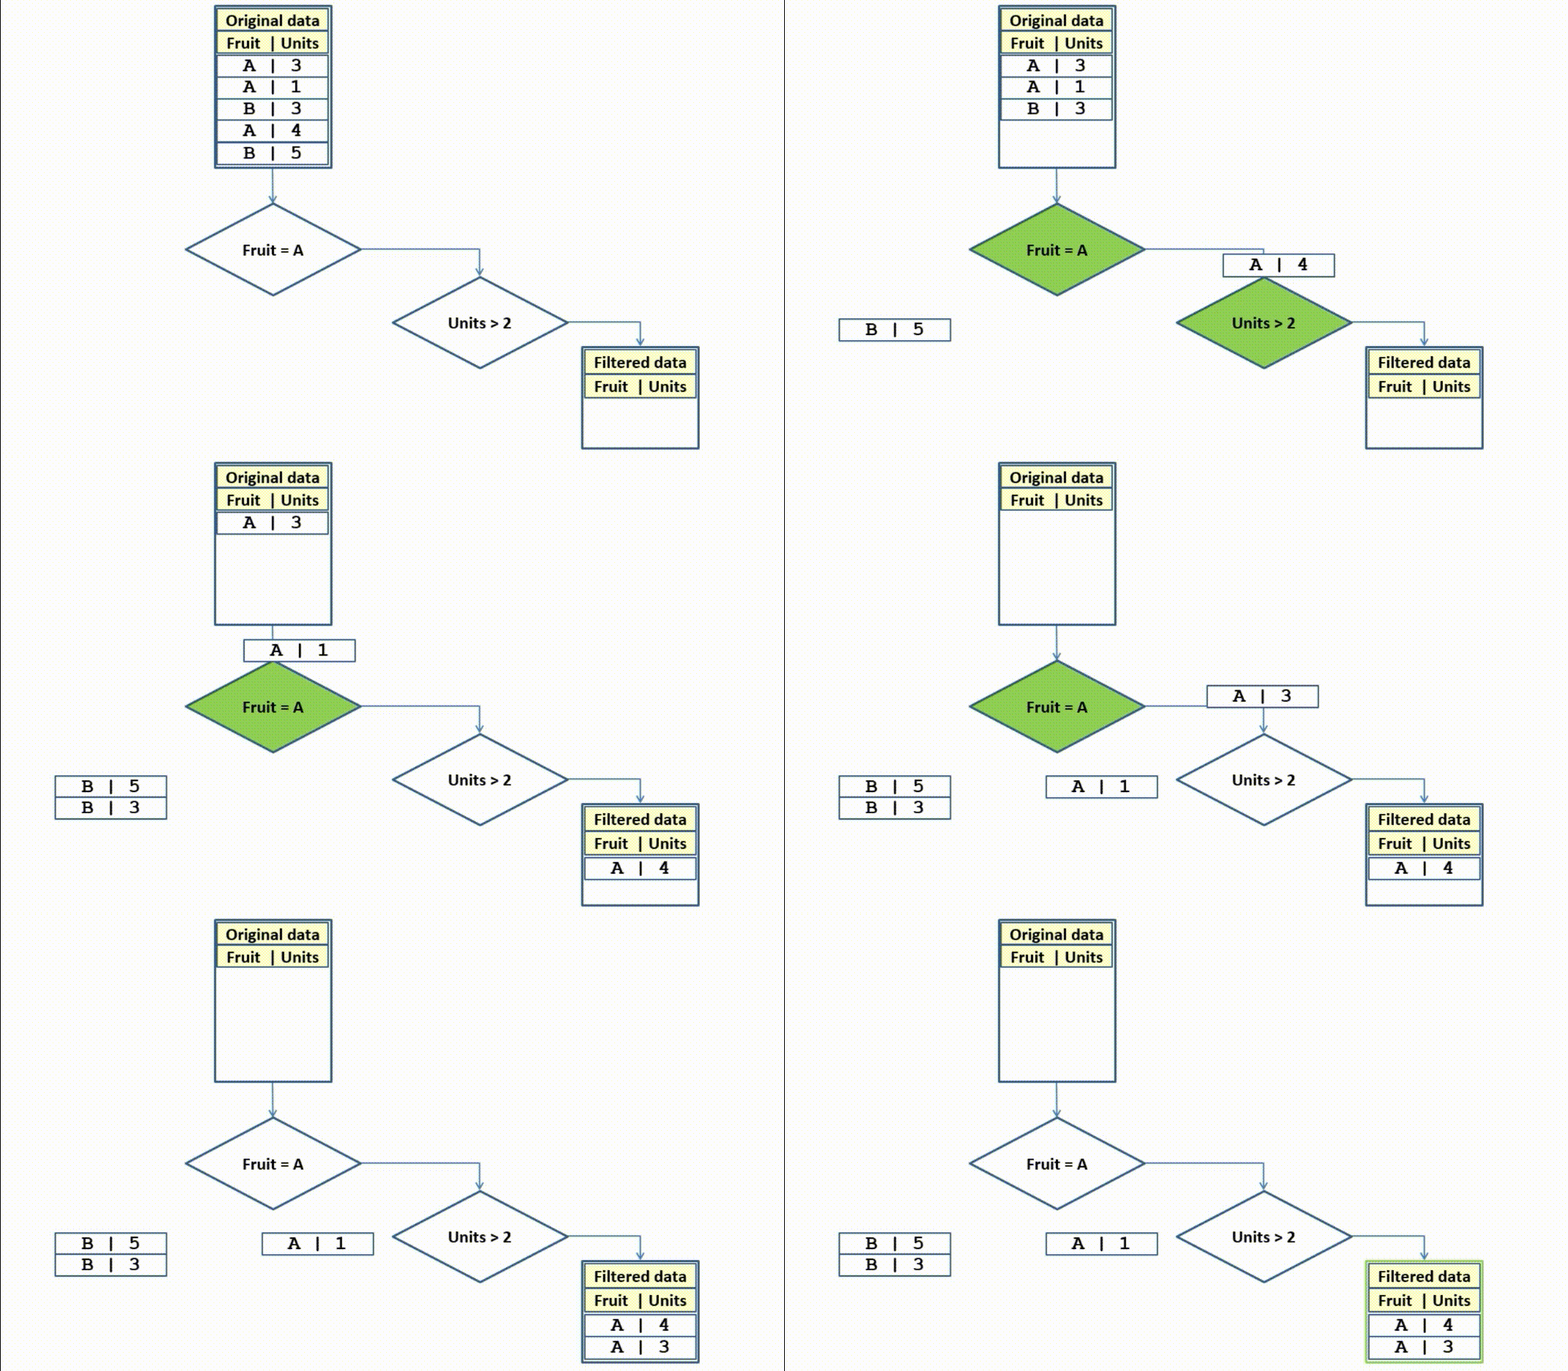
The animation below shows an example of filtering data. In this example we want to select all data whose field (Fruit) is equal to (A) and whose field (Units) is greater than (2). In the end, the table (Filtered Data) contains only data that satisfy the conditions (Fruit = A) and (Units > 2).
(2) Paste a valid SQL command
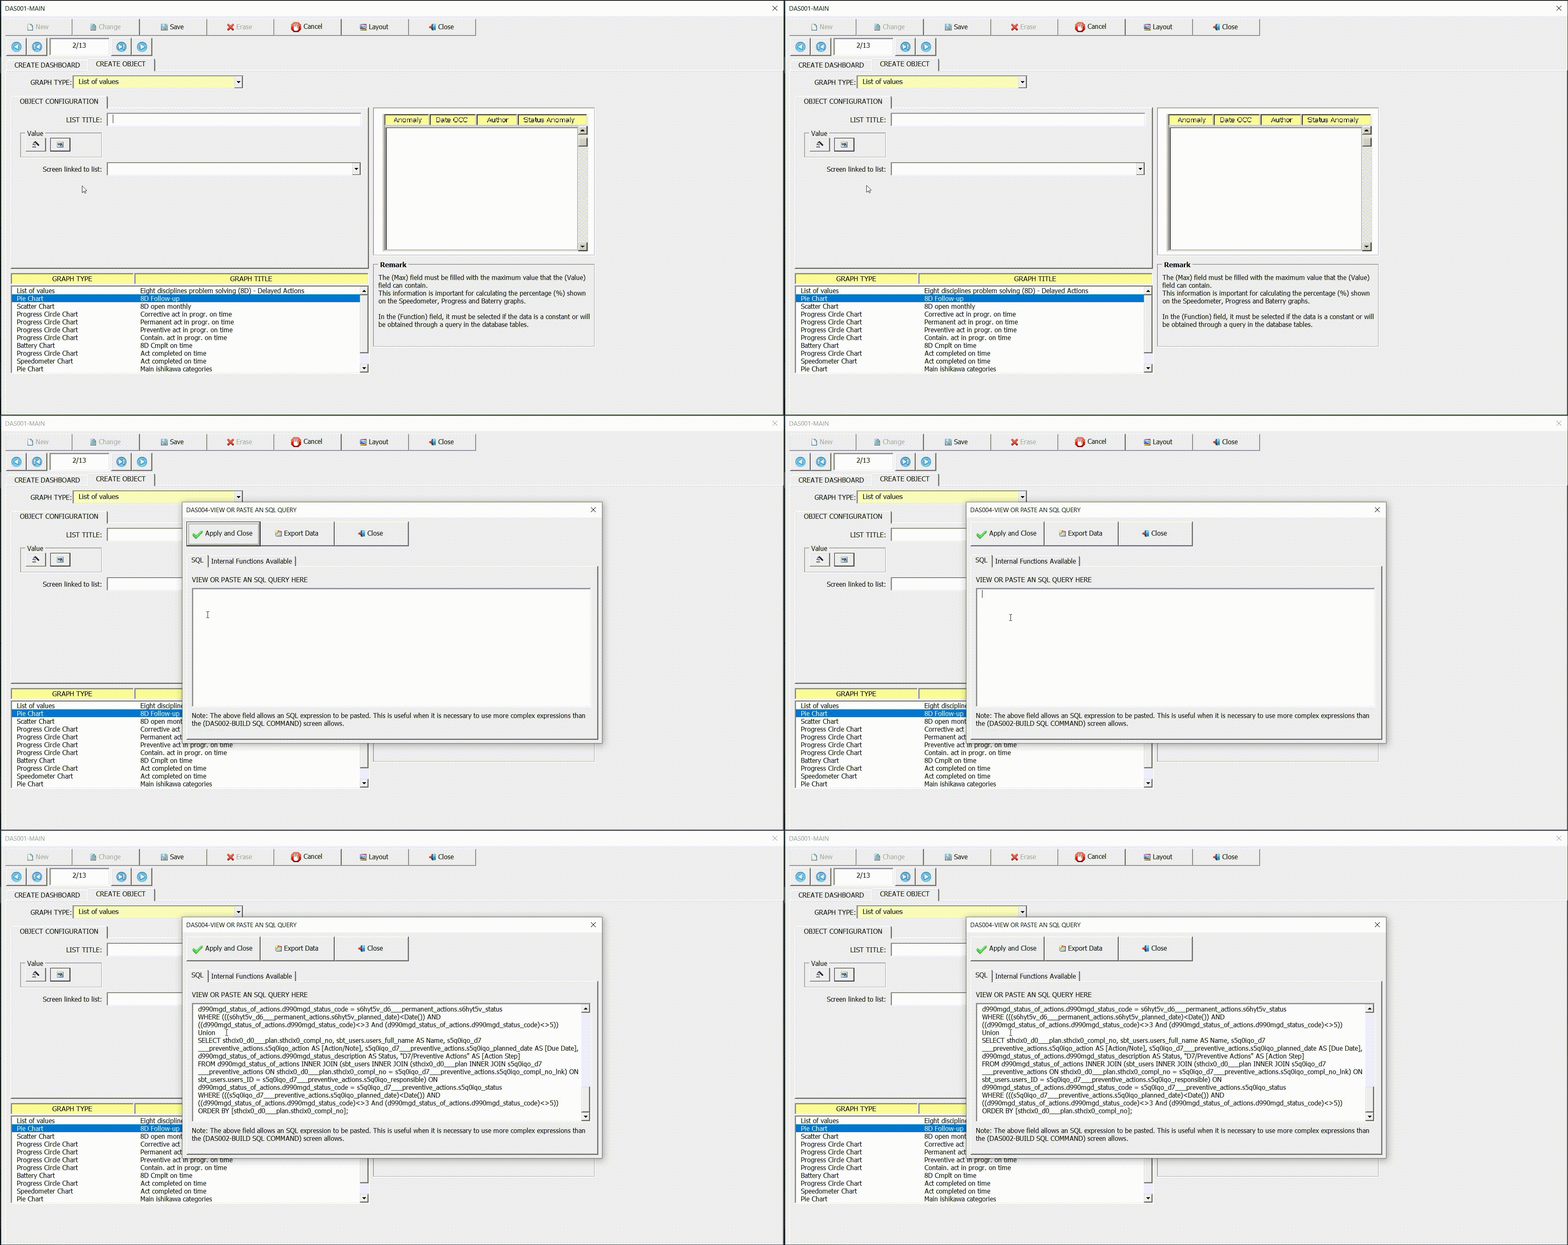
To use this option, knowledge of the syntax of Microsoft Access SQL commands is required. A simple technique is to create the query (data selection) through Microsoft Access’s own query creation wizard and then copy the expression and paste in the field (View or Paste in SQL Query Here).
Next, we will discuss how to configure each indicator used in the dashboards, and through practical examples we will give more details about these assistants.


Post your comment on this topic.