
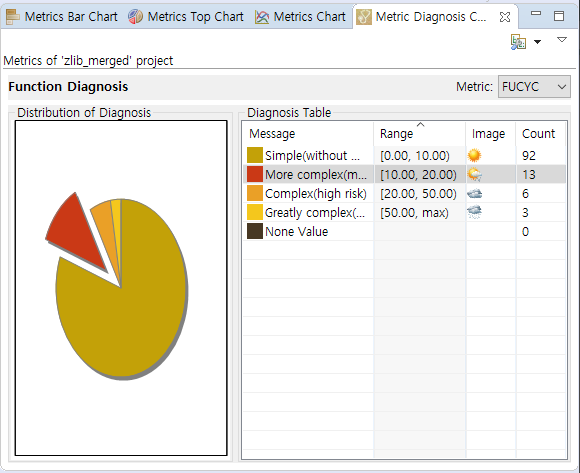
The Metric Diagnosis Chart view shows the number of items included in the diagnostic range in a pie chart. You can check the number of items within each diagnostic range in the project.
Toolbar menu
| Menu | Description |
|---|---|
| |
Changes the view mode ( |
Pull-down menu
| Menu | Description |
|---|---|
| Configure Diagnosis | Opens the diagnostics preferences page (allows you to set the diagnostic step and the ranges or images for each metric). |
| Metrics Hide/Show | Sets whether to hide or show the metrics. |
| Metric View Options | Sets whether to display the items having no diagnostic value. |
The selection of the pie chart and the selected item in the table are connected together.
Need more help with this?
Don’t hesitate to contact us here.
Copyright © 2025 Suresofttech
—
Powered by 