
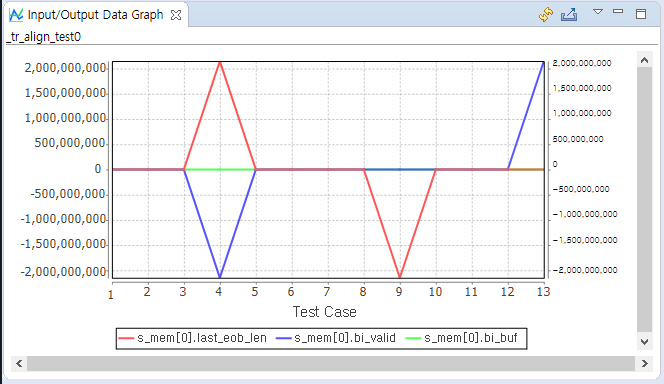
The CT provides the data for input value/expected value/output value in graph format.
The horizontal axis of the graph indicates the number of the test case and the vertical axis indicates the data of the test case.
Toolbar icon in Input/output Data Graph view
| Toolbar icon | Description |
|---|---|
| |
Refreshes the input/output data. |
| |
Saves the input/output data. |
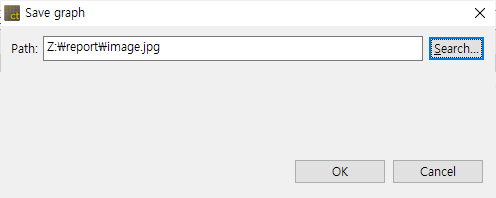
Click [Save graph] to display the notification window that can enter the path for saving the graph. Enter the path to save, the file name and the file format and click [OK] to save the graph.
Graph settings
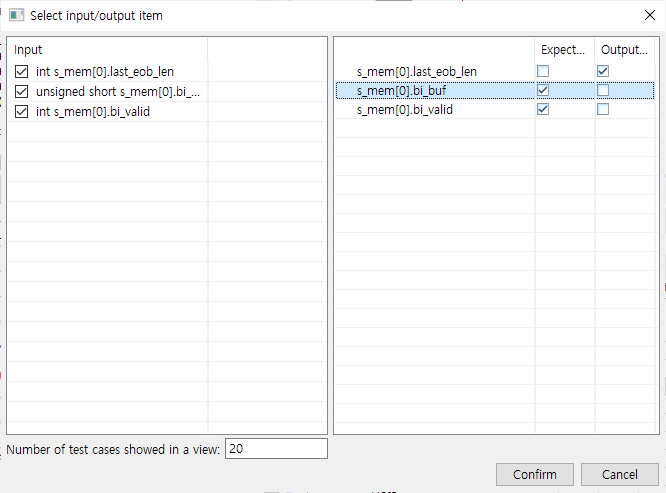
Select [Select input/output item] in the pull-down menu (▽) to display the Graph settings window.
- For the items selected in the checkbox, the [Input], [Output value] and [Expected value] are displayed in the Input/output Data Graph. However, if the expected values are specified as ~, &, | and ! etc., the expected value is not applied to the Input/output Data Graph view.
- [Number of test cases showed in a view] allows you to specify the number of test cases to be displayed on one screen.
Need more help with this?
Don’t hesitate to contact us here.
Copyright © 2025 Suresofttech
—
Powered by 