
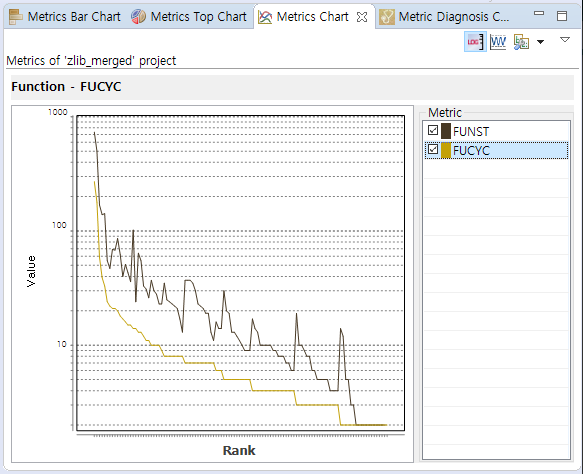
The Metrics Chart shows the metric view in a line chart. The x-axis is each item, and the y-axis is the metric value of the item. You can compare the distribution of values between different metrics each other in the project.
Toolbar menu
| Menu | Description |
|---|---|
| |
Changes the y-axis of chart to log units. |
| |
Shows the standardized metric value. |
| |
Changes the view mode ( |
Pull-down menu
| Menu | Description |
|---|---|
| Sort by | Sorts based on the selected item (even if clicking the column name in the table, it is sorted equally). |
| Set to Hide/Show metric | Sets whether to hide or show the metrics. |
| Metrics View Options | Sets the connection function with Metric view. |
Select Metric
If you select the checkbox left to the metric name in the right table, the checked metrics are displayed in the chart. If you click the metric name in the checked metric, the items are sorted based on that metric value.
Need more help with this?
Don’t hesitate to contact us here.
Copyright © 2025 Suresofttech
—
Powered by 