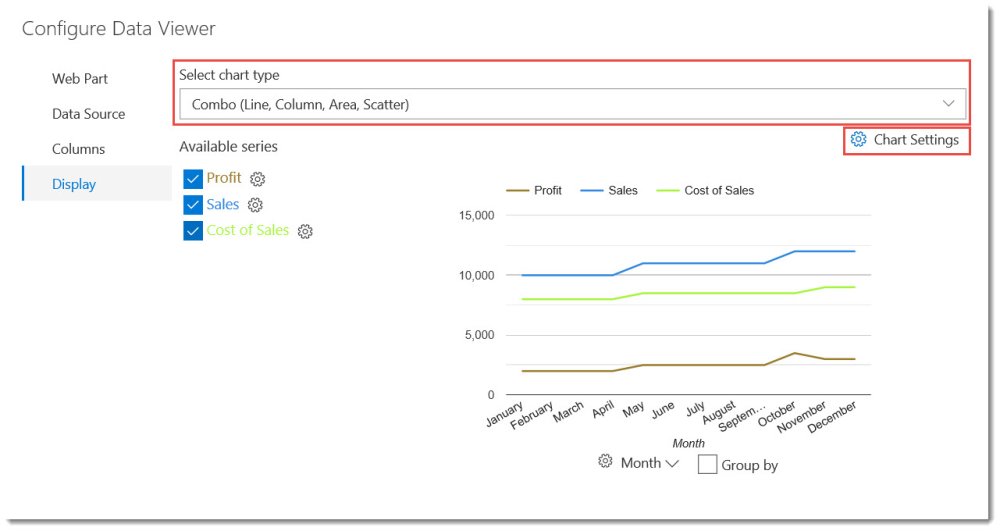
The Chart View will allow you to visualize your aggregated data in a common chart style of your choice. When the Chart view is selected on the Web Part tab, you will see options on the Display tab specifically for configuring a chart.
On the Display Tab, you will be able to configure the following:
- Chart Type – This is a choice between Combo (Line, Column, Area, Scatter) or Pie & Donut.
- Chart Settings – These will be different depending on the Chart Type selected.


Post your comment on this topic.