
We’re pleased to announce the latest addition to the QMS application suite: QMS Master Summary. This module offers a streamlined and comprehensive view of key metrics across various QMS applications, including Audit, Quality Event, CAPA, and more.
Feature Highlights:
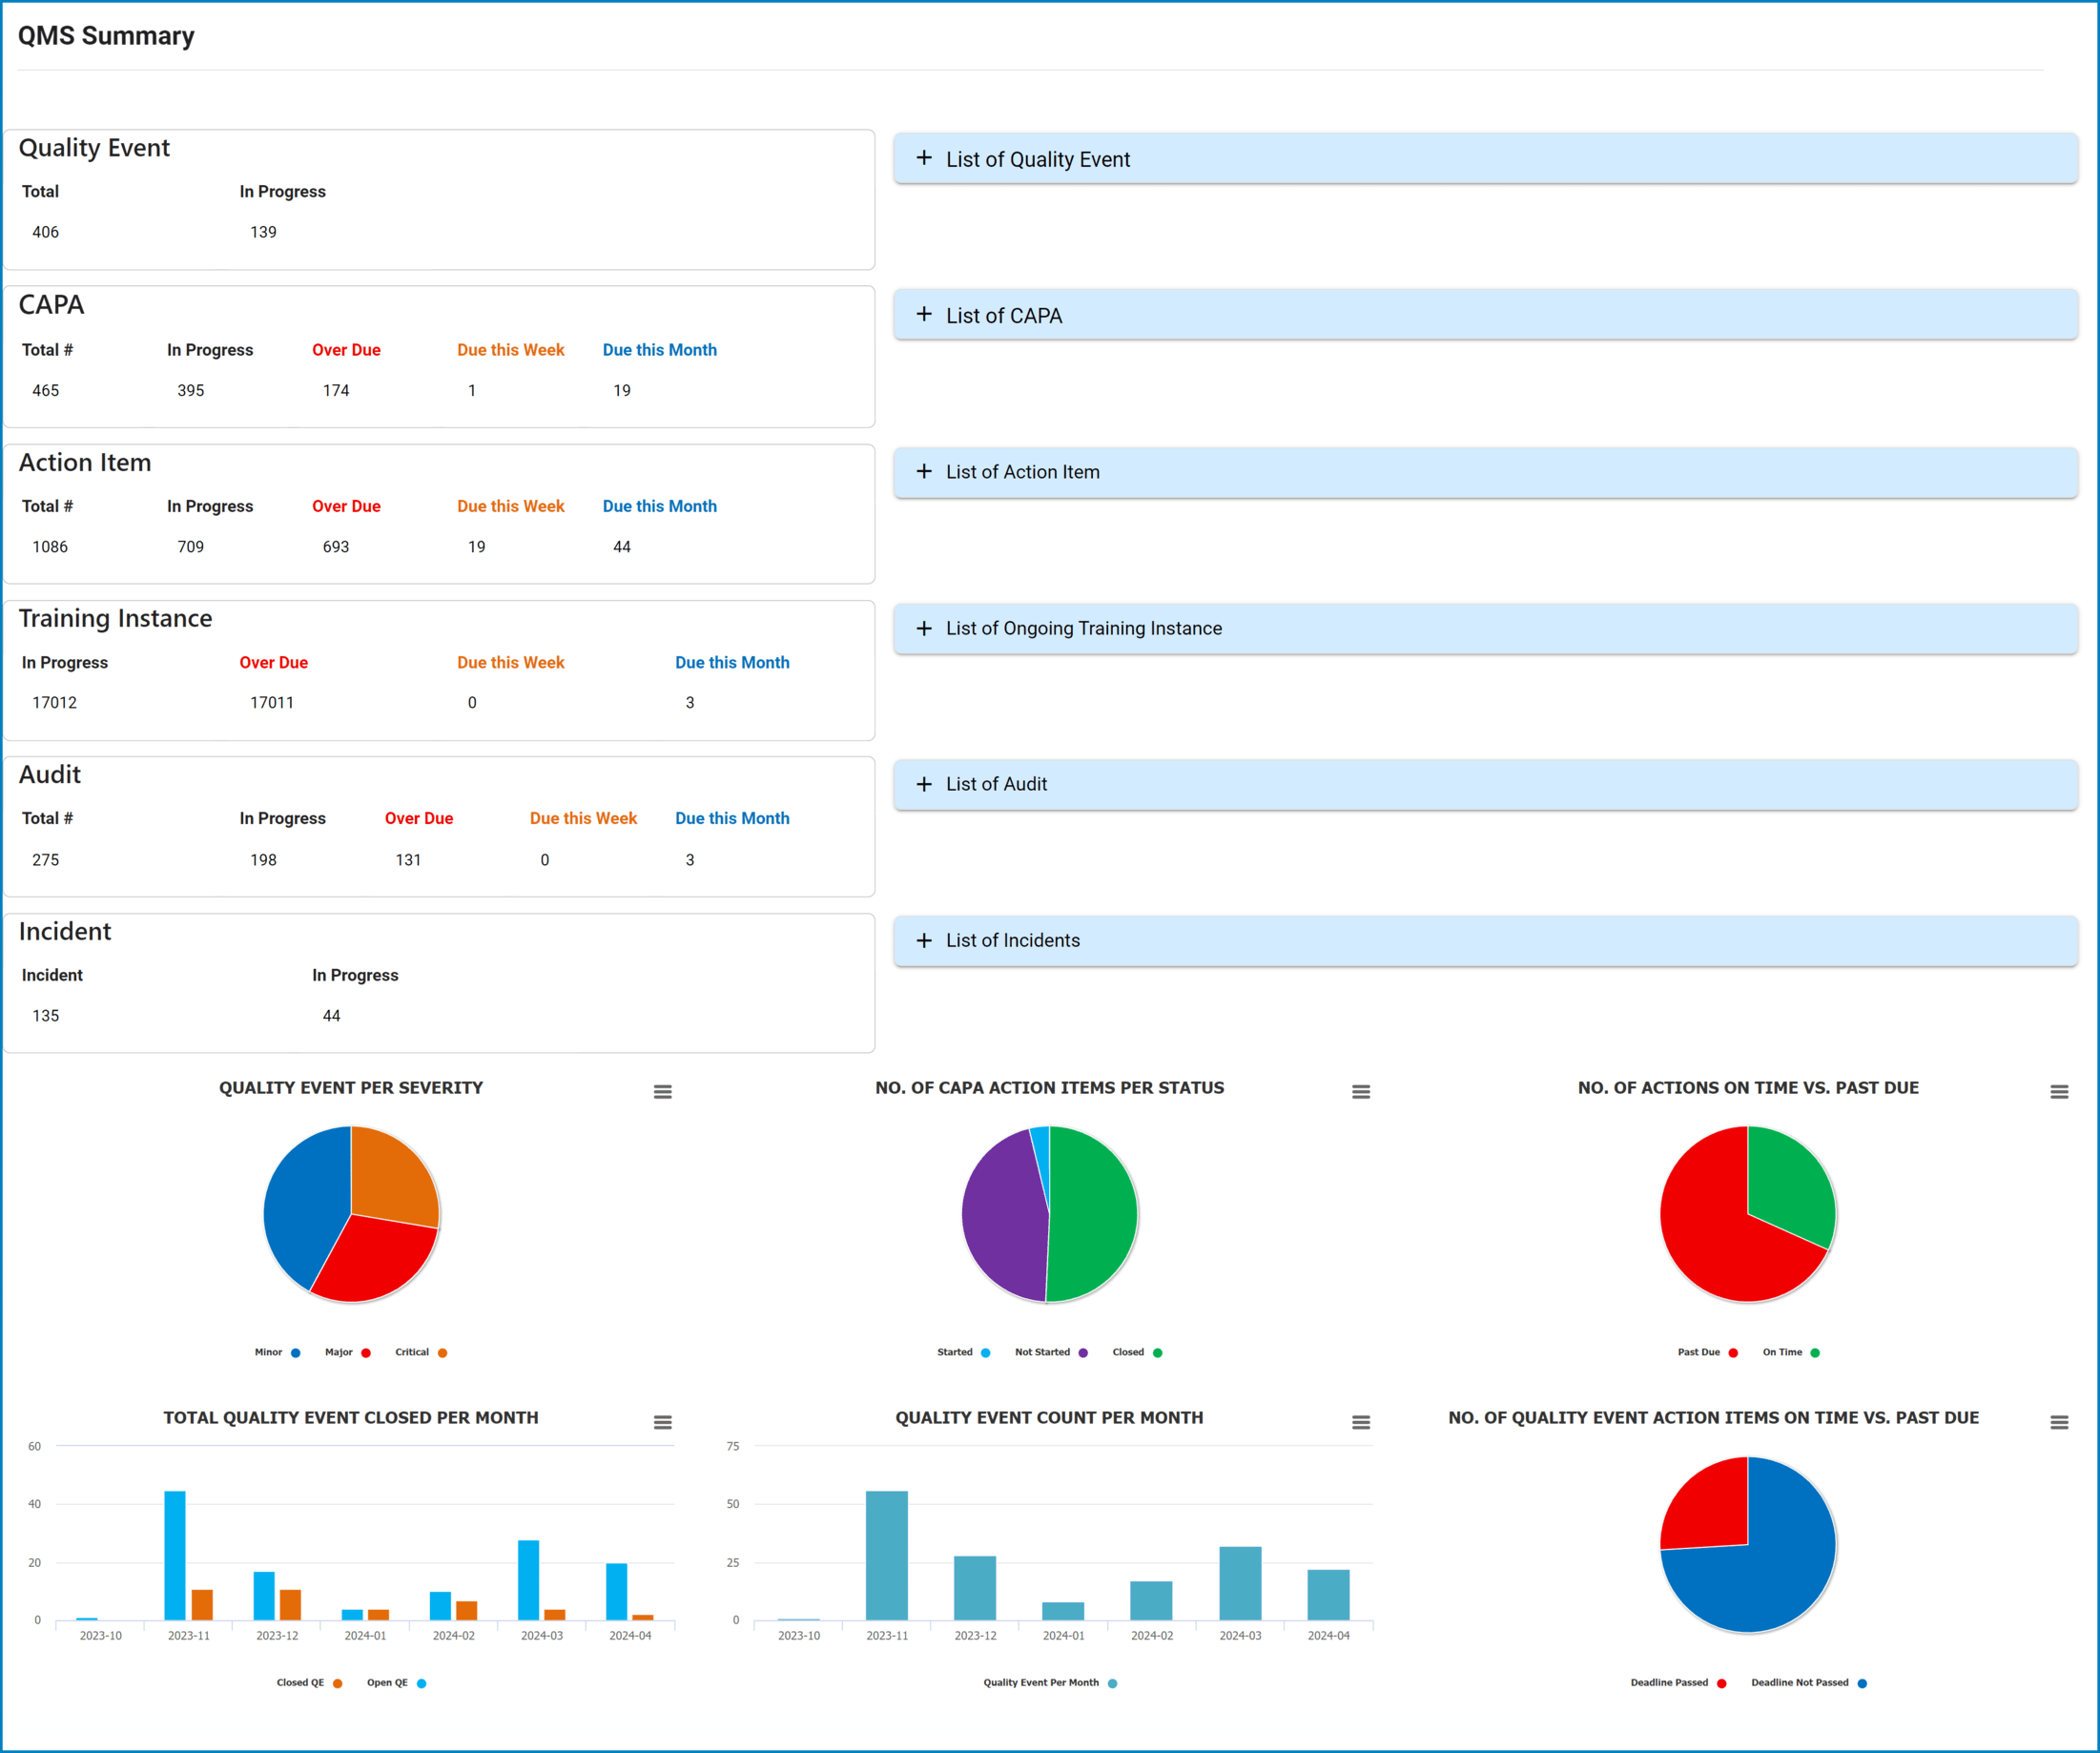
- Summary Metrics
QMS Master Summary provides users with at-a-glance insights into each application within the suite. Users can quickly access key performance indicators such as:
- Total number of instances for each application
- Number of instances in various status categories, including those in progress, overdue, due this week, and due this month.
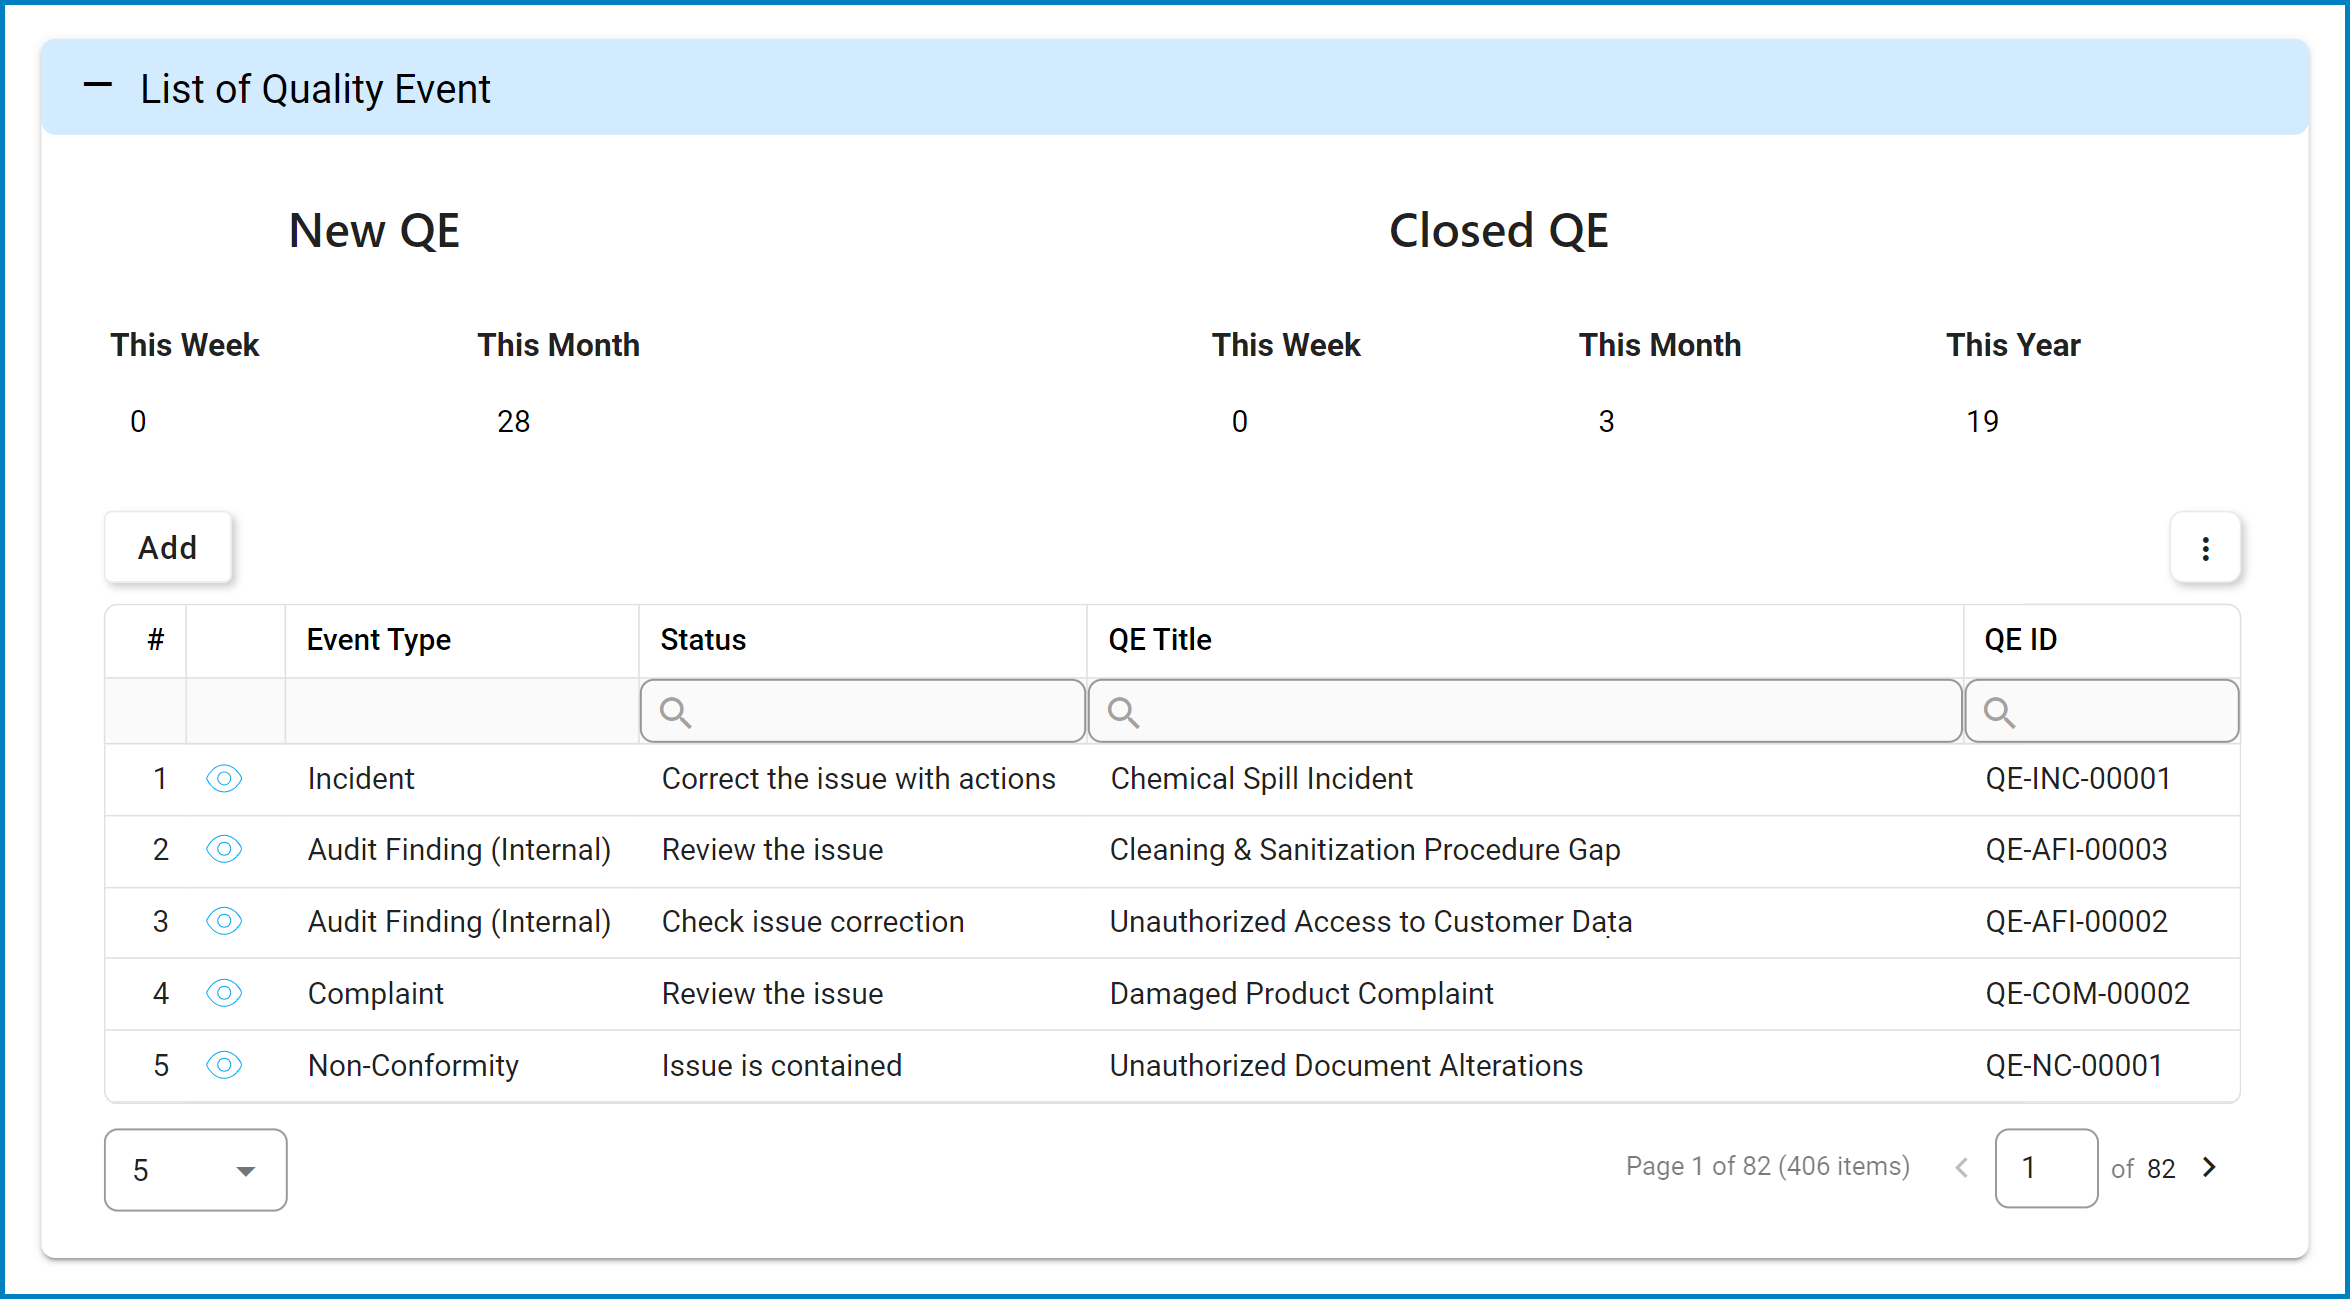
- Application Details & Trends
For a more focused and detailed view of each application, QMS Master Summary utilizes an accordion-style interface. This interface displays specific details including:
- Number of new and closed instances, highlighting activity levels for this week and this month.
- A grid listing all existing instances, with the option to add new instances directly from the summary.
- Data Visualization & Exploration
At the bottom of the module, users will find intuitive visual representations of various application metrics, including pie and bar charts.
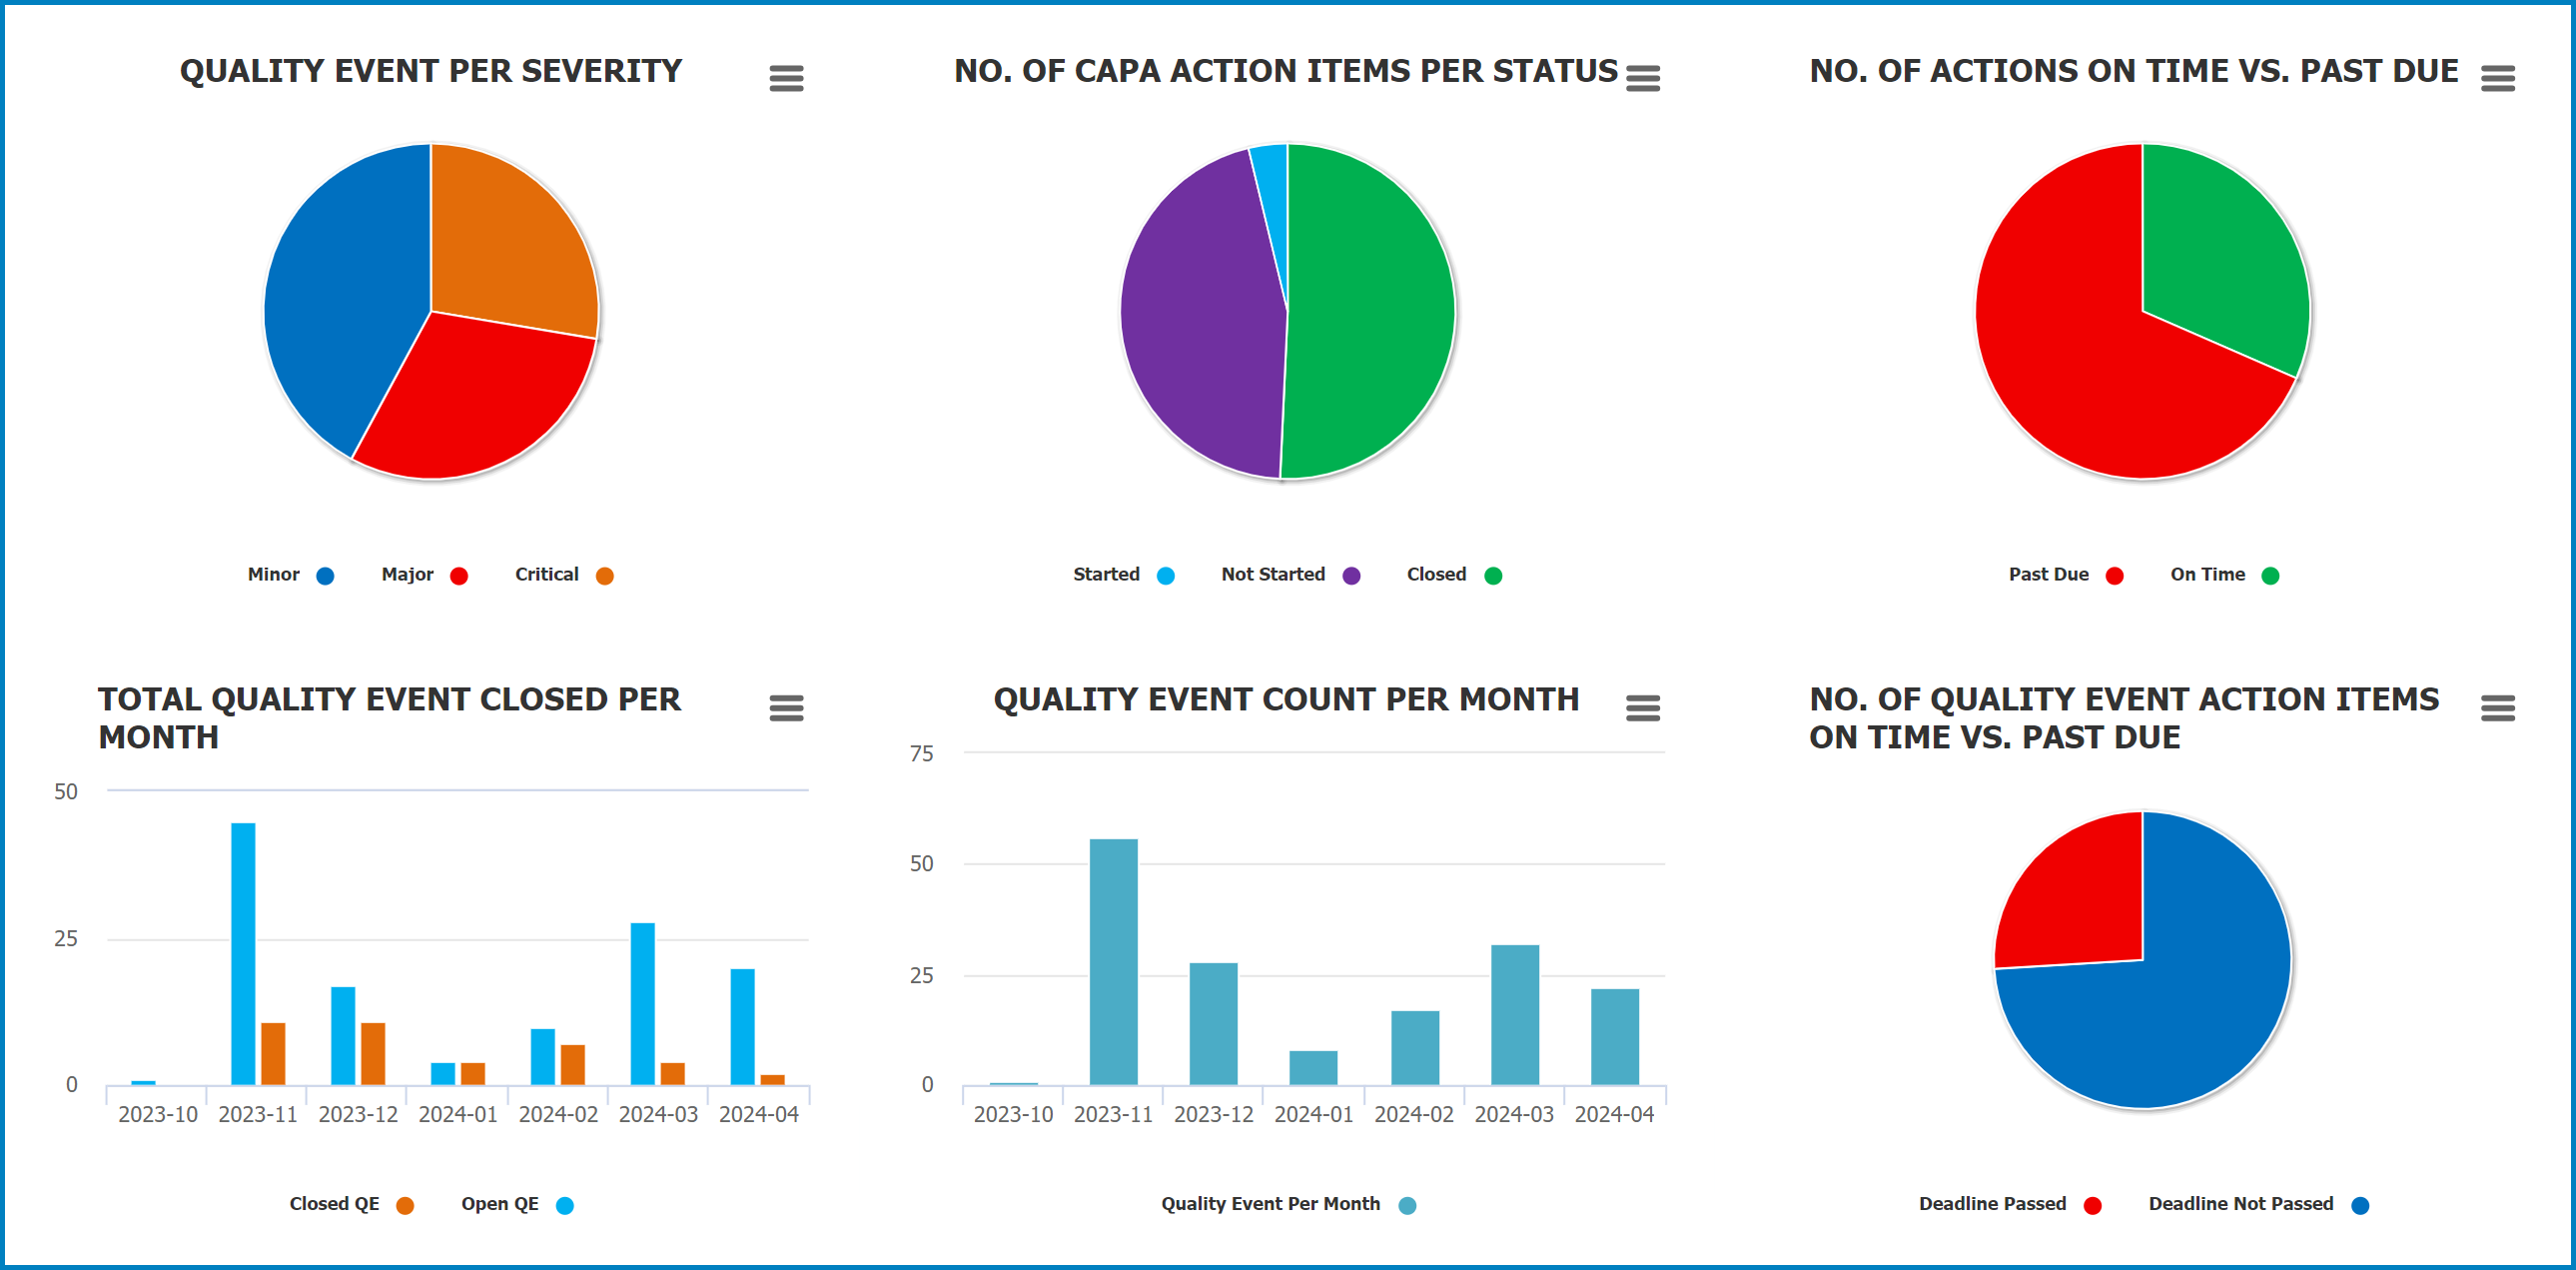
- These charts are equipped with drilldown functionality, allowing users to seamlessly navigate through layers of data. Simply double-click on any data point (e.g., slices of pie charts, bars of bar charts) to explore detailed insights.
![]()
Post your comment on this topic.