
This page gives an overview of organisation’s global Revenue, Cost of Sales and Gross Margin, but it also provides an insight into the split by Parent Project and additional drill-through options by resource entity and project details.
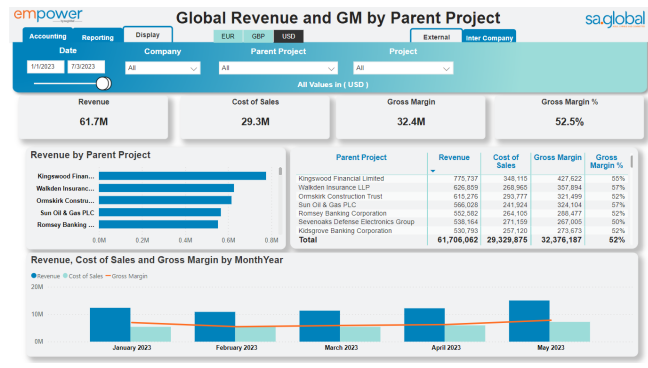
At the top of the report, right under the slicer pane there are four card visuals showing the global Revenue, Cost of Sales, Gross Margin and Gross Margin % based on the selection made in the slicer section.
What company retains after Cost of Sales is covered by Revenue is Gross Margin (GM). Gross Margin % is calculated by dividing GM by Revenue.
Below are three visuals which provide more details on parent projects:
Revenue by Parent Project bar chart.
• Table showing Revenue, Cost of Sales, GM and GM% by Parent Project.
• Line and column chart at the bottom, which shows a monthly trend of Revenue, Cost of Sales and GM – either total or for the selected Company, Parent Project or Project.
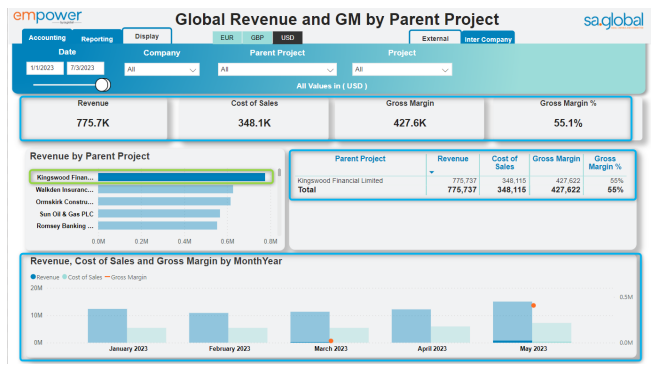
All the visuals are synchronised, which means if you click on one of the parent projects on the Revenue by Parent Project bar chart or the table next to it, the chart below will automatically re-draw to show monthly trend of Revenue, Cost of Sales and GM related to that parent project. Other visuals – cards and the table will get updated too.
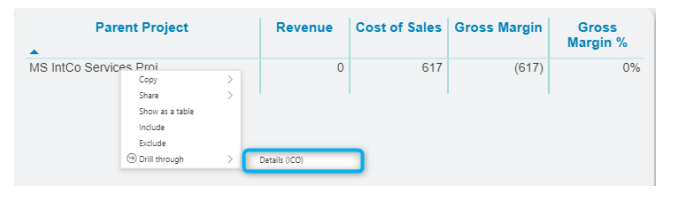
Each visual can be drilled down to two additional pages in case of External view and one additional page in case of Inter Company view. The difference is in drill-through page Revenue by Resource Entity which adds value to the user only in the case of External view (shows the structure of external revenue by entities that provided resources)
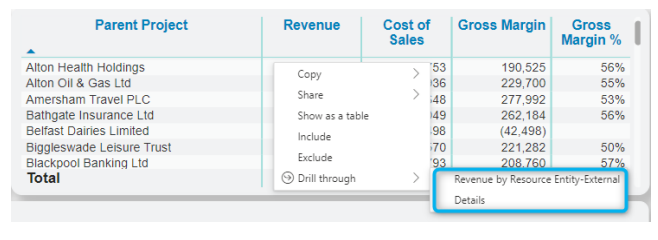
If you would like to see more details just for a particular parent project, you should right-click on that parent project, however, if you would like to see the split for all parent projects, you should right click on the Total.
Post your comment on this topic.