
Overview of ICO reconciliation view
This page also gives the difference between the AR and AP balance generated in the intercompany transaction of the selected combination of companies, while the result is displayed in slightly different format than on the 1st page.
The view of the 2nd page of the report (ICO Comparison) is shown in the following screenshot

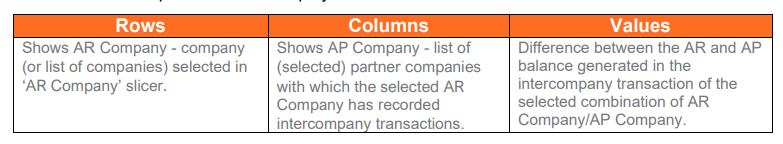
The below table explains the data displayed in the matrix visual:
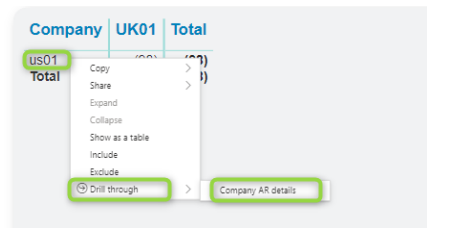
You can right click on an AR Company in the rows and select Drill through > Company AR detail
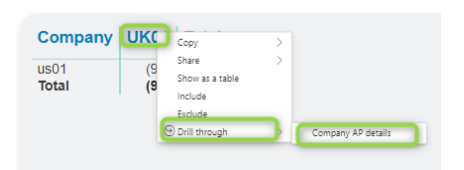
Similarly, you can right click on an company AP Company in the columns and select Drill through > Company AP details
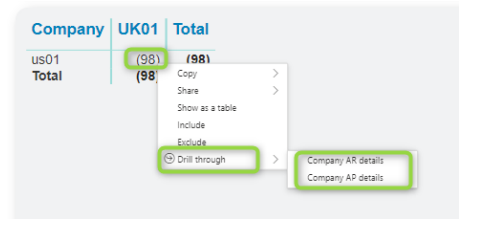
If you right click on the value (at the intersection of a row and column) you can choose between Company AR details and Company AP details, which will show the same details but from opposite viewpoints.
All subsequent steps and features listed in the previous section (Details page and tooltip) are available here as well.
Post your comment on this topic.