
empower finance balance sheet page
At the top of the report, in the card visuals you can see the
- Cumulative values of Assets
- Liabilities
- Equity
Of the selected company/group.
There is also the Current Ratio as one of the main liquidity ratios, considering the *weight of current assets versus current liabilitie*s.
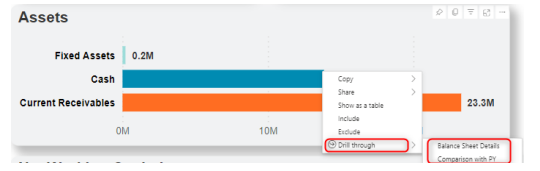
The Assets grid is showing the values of all types of Current assets and Non-current assets.
The Liabilities and Equity grid is displaying the values of the Equity and all types of Current liabilities and Non-current liabilities.
You can right click on any of the:
- Asset type
- Liability type
- Equity
Select Drill throug*h and view the financial details on Comparison with PY (Previous Year)* or Balance Sheet Details page.
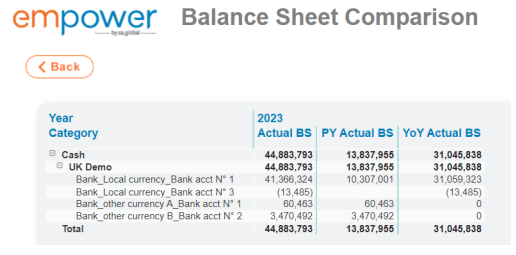
If you select the Comparison with PY option, you can view the following columns on the Balance Sheet Comparison page:
• Category – View the list of Main accounts of the selected category.
• Actual BS – Actual balance details for the selected year.
• PY Actual BS – Actual balance details of the previous year.
• YoY Actual BS – Difference between the actual balance and previous year’s actual balance amount
If you select the Balance Sheet Details option, you can see the balance details of a company/group for each month/quarter based on the number of months that you select in the Month slicer. Use the Drill on Rows and Columns in the top right corner to drill up or down to the next level.

Going back to the main page, the Net Working Capital (NWC) bar graph is showing the:
- Current assets,
- Current liabilities
- NWC by month selected in the Month slicer

On the Quick accounts grid, view the various financial details of the selected company/group

Post your comment on this topic.