
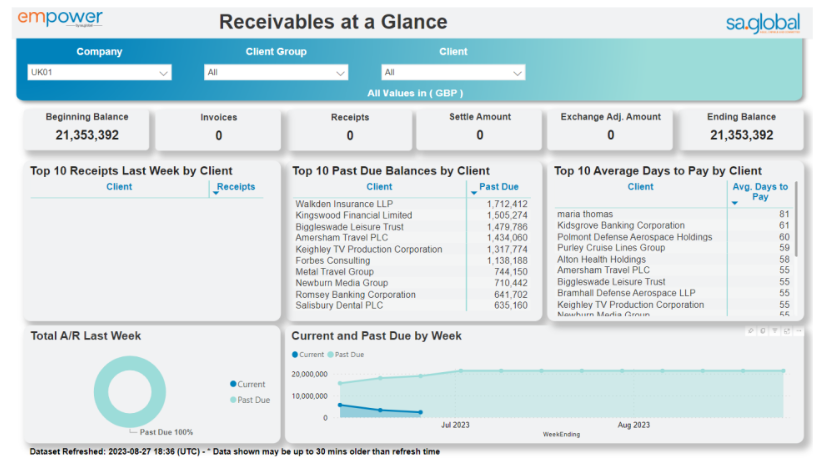
Receivables at a Glance
This page provides an overview of the selected company’s Accounts Receivable, focusing mostly on the last week’s information.
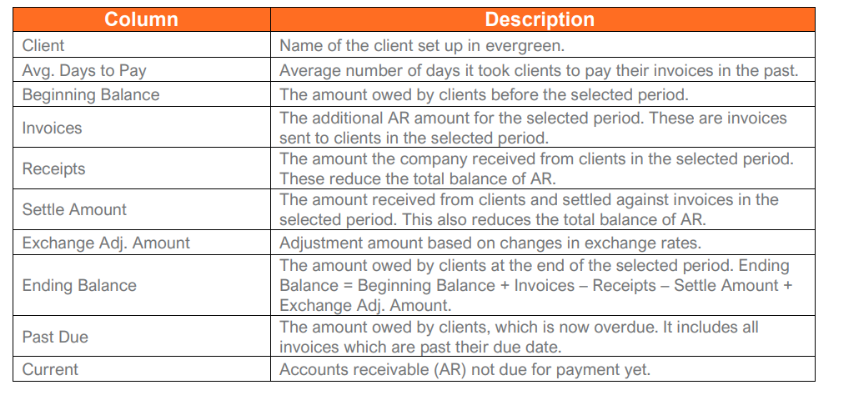
The table below explains the columns used on ‘Receivables at a Glance’ page:
The doughnut chart shows the percentage of Current and Past Due amounts within the total Accounts Receivable amount
The visual on the right side of the page shows a weekly trend of Current and Past Due amounts.
Feedback
Copyright © 2025 sa.global
—
Powered by 
Post your comment on this topic.