
This page allows us to understand the total number of full-time workers in the organization: how this number has been changing historically on a monthly basis, as well as the current FTE per worker.
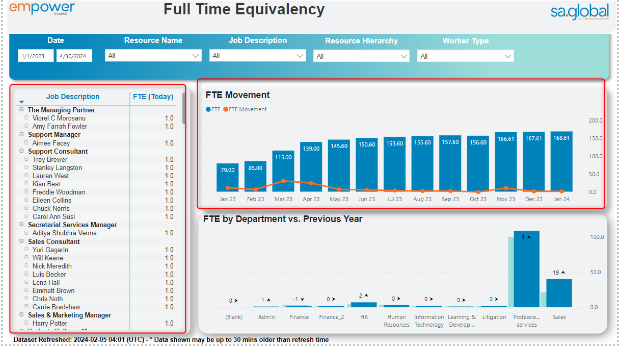
It also provides a quick view of the comparison of FTE by department at the end of the selected period and the same period a year earlier.
For example:
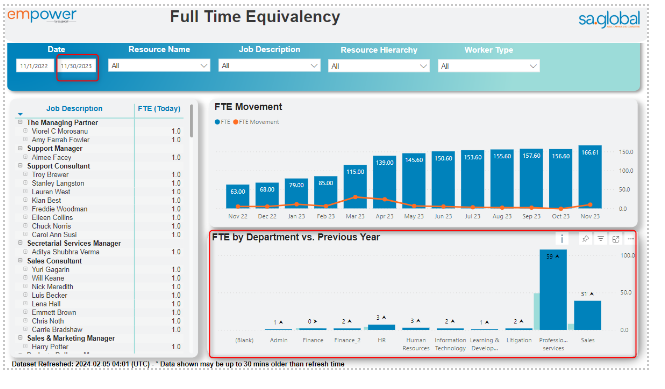
In this case, the visualization compares the FTE by department at the end of November 2023 with the FTE at the end of November 2022. The arrow indicates an increasing/decreasing trend, while the number shown next to the arrow represents the difference.
The top slicers section allows us to change the time period for which we want to conduct analysis, quickly search through the list of employees or list of jobs. We can also narrow the scope of FTE trend analysis for a specific legal entity or type of worker.
Post your comment on this topic.