
Overview
This document aims to answer questions and provide guidance about how to use empower project
reports.
The document explains each page, drill-through page, and slicers in detail.
empower project report
empower project provides insights into project and portfolio KPIs indicating project health and
flagging potential risks, but it also provides detailed reports and drill-through options which enable
root-cause analysis and data-driven decision-making.
Slicers
The top section of the report shows slicers, which allow slicing and dicing of data in various ways.
Every page of this report has a slightly different slicer section, however Project Name / ID and Project
Manager slicers are common to all pages
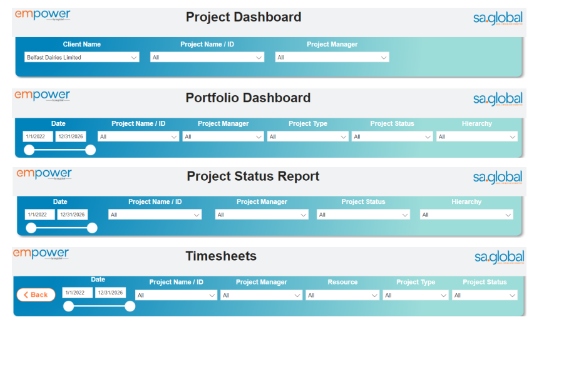
The below table explains each slicer available in the report
| Slicer Explanation | Description |
|---|---|
| Client Name | The name of the client whose projects are being analyzed. |
| Project Name / ID | The name and the unique identifier of the project that is being analyzed. |
| Project Manager | The name of the Project Manager in charge of the selected project. |
| Date | The time period that is being analyzed. |
| Project Type | The type of the project such as Time and Material, and Fixed Price. |
| Project Status | Project Status indicates whether a Project is Active or Inactive. |
| Hierarchy | A combination of Client Name and Company within the organization. |
| Resource | The name of the resource working on the selected project. |
Once the filters are provided in the above-mentioned slicers, the report will automatically update the
rest of the report.
The slicers that appear on more than one page are synchronised across the report, meaning, if a
particular project is selected in the Project Name / ID slicer on the Project Dashboard, the other
pages will update to show the same project.
Note that at the bottom of each page there is a timestamp that shows the time the data was last
refreshed. Time is expressed in UTC time (Coordinated Universal Time)
Post your comment on this topic.