
h2.Overview
Portfolio Dashboard gives an overview of projects grouped by certain criteria (e.g. Client (within hierarchy), Project Type, Project manager)
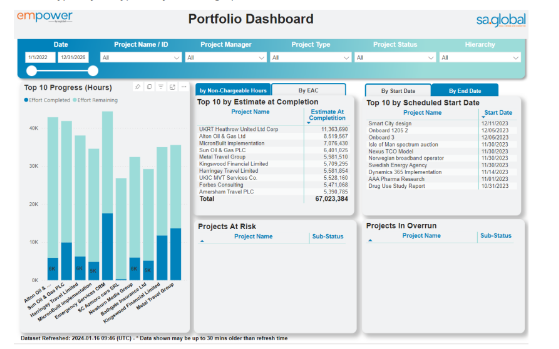
The dashboard gives insights into:
• Progress chart which indicates the remaining effort for each project within the portfolio.
• Tables flagging top 10 projects in Overrun, At Risk, projects with high percentage of NonChargeable work and those with the highest EAC.
• Tables flagging the projects that have recently started and those finishing soon – top 10 by scheduled Start Date and End Date.
• Drill-through to weekly rolling totals for Planned Revenue, Total Revenue and the status
which indicates if the project is Underbudget, On Track, At Risk or in Overrun.
• Drill-through to details such as Timesheets, Resource Details and Project Schedule
| Column | Description |
|---|---|
| Effort Completed | Completed work expressed in hours. |
| Effort Remaining | Remaining work expressed in hours. |
| Non-Chargeable Hours % | The percentage of Non-Chargeable Hours within Actual Hours. |
| Estimate at Completion (EAC) | Actualized forecast based on actuals and ETC. |
| Start Date | Scheduled Start Date of the selected project. |
| End Date | Scheduled End Date of the selected project. |
| Sub-Status – Projects At Risk | This Sub-Status flags projects which are above budget for the period, but not over the total budget amount. |
| Sub-Status – Projects in Overrun | This Sub-Status flags projects which are above the total budget amount. |
Post your comment on this topic.