
This page contains the same card visuals as the Main Report, however different chart. Except for the line that represents Actual Cash Balance and Expected Cash Balance on a weekly basis, this chart also contains the columns of different colours.
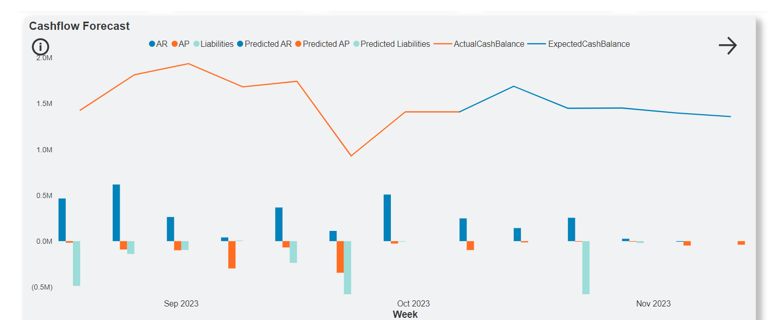
The table below explains the meaning of each column:
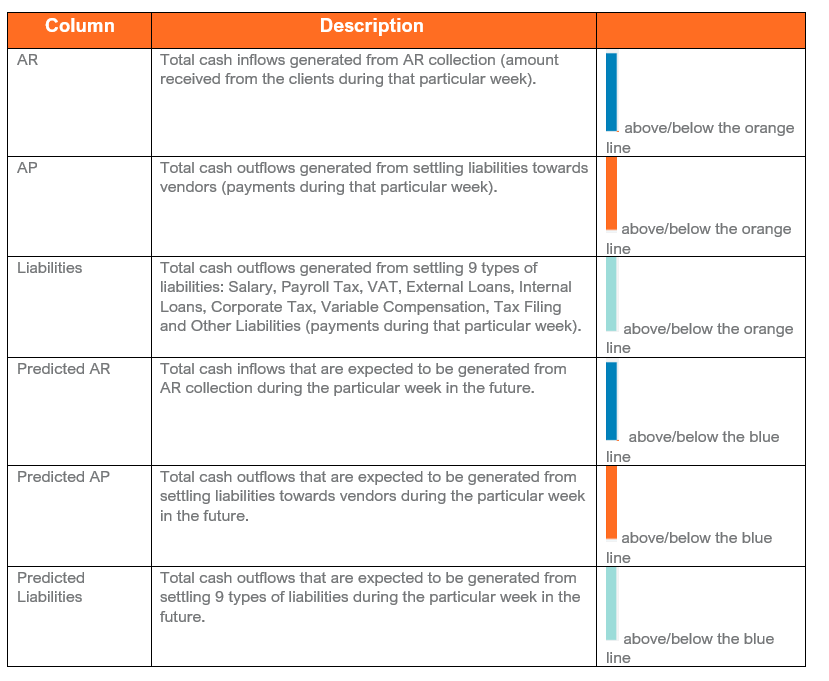
You can hover over any column what gives you the tooltip with information about when the week you are looking at stared and ended, as well as the value of selected category:

You can right click on the column AR which gives you the option to go to a new page with additional details (Drill through > AP/AR Breakdown):

Same drill through page provides details for the AP column. For Liabilities column there is a drill through page Liabilities Breakdown, while in case of Predicted Liabilities it is the Expected Liabilities Breakdown.
Details for Predicted AR and Predicted AP are obtained in a slightly different way- not via a drill through page, but via a button that takes us to the hidden details page *Expected AP / AR Breakdown.
*
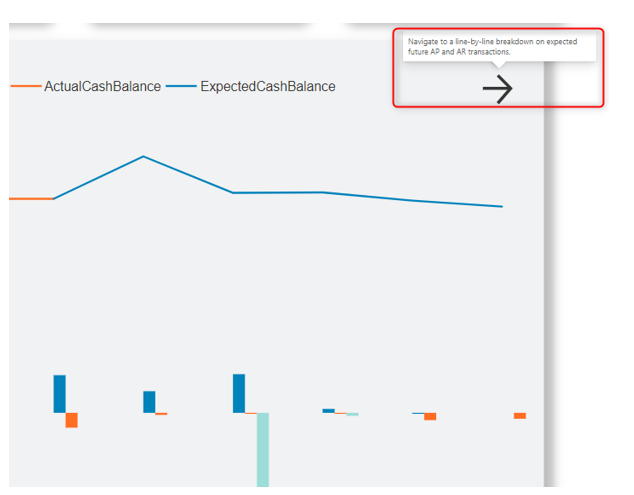
Each of these 4 pages will be explained in detail.
Post your comment on this topic.