
Overview of Group report
Group Report provides a financial data overview of entire organisation and highlights the company with the highest and lowest profit.
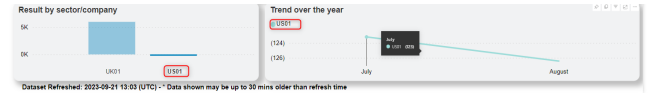
It also shows profitability trend of every company over the year
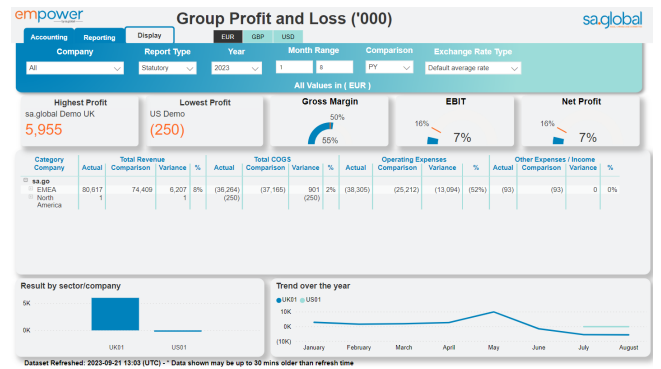
If a company is selected in the bar chart on the left, the line chart on the right will then highlight the trend of that company. Other visuals will get updated too.
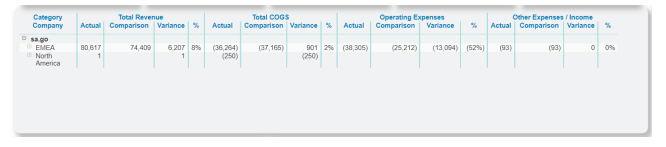
Matrix visual shows Actual, Comparison and Variance, but split by main P&L categories (Total Revenue, Total COGS, Operating Expenses and Other Expenses / Income).
Feedback
Copyright © 2025 sa.global
—
Powered by 
Post your comment on this topic.