
Apart from various KPI visuals, there are three main visuals on this page:
1) Cashflow Forecast graph includes two lines that are connected. The orange line is showing what bank balance has been for the past six weeks, while the blue line is showing what we predict our bank balance will be in the next 6 weeks.
2) Top 10 Upcoming Vendor Payments (AP) shows the list of vendor invoices with the greatest value that are coming due for payment in the next 6 weeks. Apart from the value (remaining balance to be paid) and Invoice number, there are also columns showing Vendor name, Due date of the invoice and type of vendor (external or ICO).
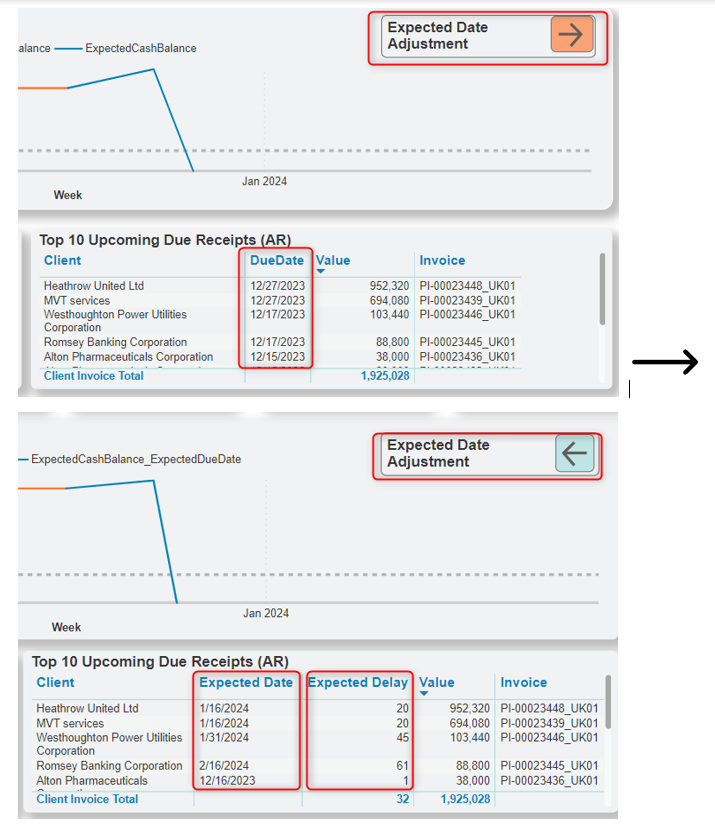
3) Top 10 Upcoming Due Receipts (AR) shows the list of client (customer) invoices with the greatest value that are coming due for payment in the next 6 weeks. Apart from the value (remaining balance to be paid) and Invoice number, there are also columns showing Client name and Due date of the invoice. This view is based on the assumption that our clients will pay us on the due date, what is not always likely.
One of the main features of this model is the ability to predict, based on the client’s past behaviour, how long their payment to us will be delayed. If we click on the button ‘Expected Date Adjustment’, the due date will be replaced by the expected date. The model calculates the average number of days late they were on all the past client invoices and adds it to the due date of the currently open customer invoices. These average days late will be also shown in the additional column as Expected delay.
The table below explains the meaning of the data displayed in remaining (card) visuals on the Main Report page:
Financial MetricsFinancial Metrics
| Column | Description |
|---|---|
| Minimum Cash Balance | Set liquidity threshold that is required to be kept in the bank account. |
| All Values in () | Shows the accounting currency of the selected legal entity. |
| Bank Account Balance * | Shows the latest bank account balance (the sum of all bank transactions up to now). |
| Total Reserve | Difference between the Bank Account Balance and the required liquidity threshold (Minimum Cash Balance). |
| Delayed Payment Due Today * | Shows the total unpaid amount (remaining balance) of vendor invoices that are due for payment. |
| Overdue Receipts * | Shows the total unpaid amount of client (customer) invoices that are now due (outstanding balance). |
| Days Until Minimum | Shows the number of days until the date when the Expected Cash Balance is expected to fall below the liquidity threshold (Minimum Cash Balance). If this number is more than three months from today’s date, then this indicator will be shown as not projected. |
There are three hidden pages to which links send us to from the Main Report page (from the above mentioned card visual):
1) Bank Account Balance *
2) Delayed Payment Due Today *
3) Overdue Receipts *
Post your comment on this topic.