
Overview of monthly report
Monthly Report is a more traditional layout of Profit & Loss where margins are shown below Revenue and Cost of Revenue and total actuals are split by month. This report also enables P&L analysis from various Financial Dimension perspectives.

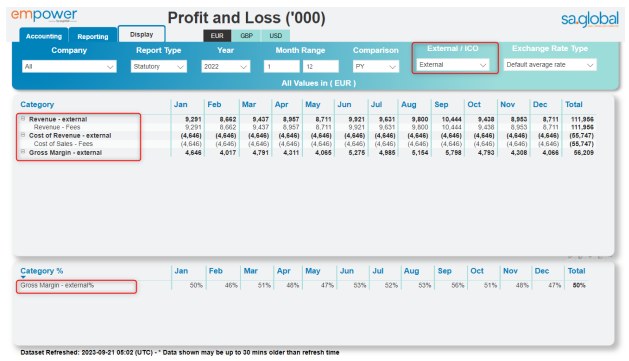
Both Total Revenue and Total Cost of Revenue are split into external and intercompany, what allows splitting into External / ICO / Total view:
• External view: shows only external items (revenue – external, cost of revenue – external and gross margin – external
• Inter Company view: shows only intercompany items (revenue – intercompany, cost of revenue – intercompany and gross margin – intercompany)
• Total view – if all values are selected (External + ICO + Other): this view provides a full traditional layout of Profit & Loss including also P&L categories/profit margins below gross margin. Once Cost of Revenue is covered by Revenue, we get Gross Margin. Then Operating costs are covered, which gives EBIT. Lastly, Other Expenses / (Income) are added, which makes up company’s Net Profit.
Example (External view):
In order to analyse the report by Financial Dimensions, you need to right-click on the number you would like to analyse – but only at the main account level (Audit Fees). Drill through page will not be available when clicking on a category row (e.g. Operating Expenses).
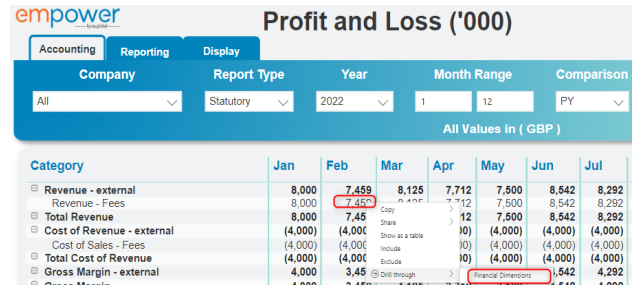
Drill-through page contains several table visuals – one for each financial dimension. Each table breaks down the number selected on the previous page by financial dimension:

The scope of the analysis can be narrowed down by pressing Ctrl on the keyboard, which allows a multiple selection.
Example:
Client: Amersham Travel PLC + CTRL + Cost Center: West
This is how we check the remaining dimensions (Business Unit, Department, Project) that change dynamically for the given selection

It is important to point out that the model is flexible to pick up any new Financial Dimension from the source (evergreen). It will automatically become visible within the FinancialDimensionLookup
table. It will only be necessary to introduce new dimension into the table visual, following the example of the other visuals on this page.
Finally, Gross Profit, EBIT, Net Profit and Gross Profit by revenue types (e.g. Service) are divided by Revenue and shown as percentages by month.

To see further details, right-click on one of the Actuals and select Voucher Details.

This opens a new drill-through page which lists all the vouchers for the selection you previously made and details shown below:

Post your comment on this topic.