
| Indicator | Description |
|---|---|
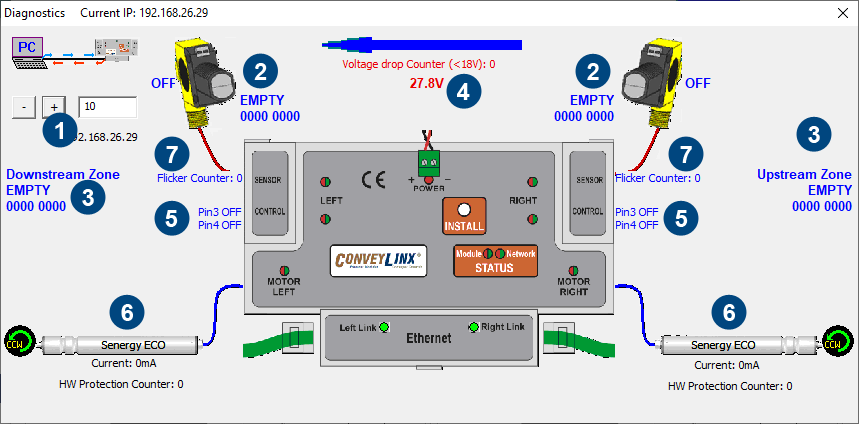
| You can navigate to the next or previous module’s Diagnostic Window by clicking the + and – buttons | |
| Displays the current ZPA status of the zone and the state of the sensor | |
| Displays the status of the upstream and downstream zones to the selected module. Note that the values depicted below the text (“00 00” in the example) indicate the contents of the Tracking Registers. Please refer to ConveyLinx ERSC PLC Developers Guide for details on how to use the Tracking Registers | |
| Displays the current input voltage to the module as well as the count of the number of times the power supply went below 18 volts but did not completely shut off. This is useful for diagnosing possible power supply issues | |
| Displays the current state of each Sensor Port and Control Port input signals | |
| Displays current status of each motor. Please note that this data is also shown on the main screen as well | |
| Displays current value of the sensor input’s Flicker Counter |
Accumulation Status
If a carton is accumulated on a particular zone, the Diagnostic Window will indicate a reason for the accumulated state. Also note that in situations where an external device (PLC or PC controller) or the Accumulate icon on the Main Screen has been activated; the Sensor LED on the module for the stopped carton’s zone will be fast blinking green. You can then consult the Diagnostic Window for more detailed information on the exact reason
| As shown in this example, for the downstream zone on the selected Module, it shows “Pin3 Control Port Accumulation” as the reason a carton is stopped at this zone even though the zone that is downstream of this module is empty | 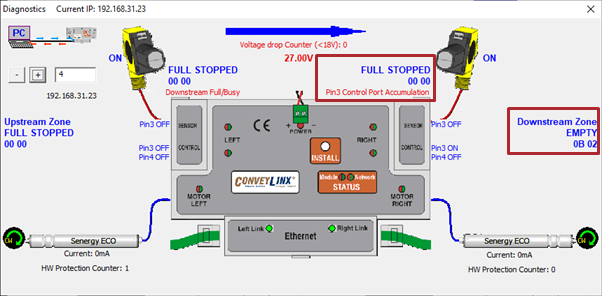 |
Flicker Counter
The Flicker Counter contains a running total of the number of state changes that have occurred during the Sensor Debounce time window. This can be used as diagnostic information to help you adjust the proper Sensor Debounce time for a given application