
Users can personalize the display of process maps in the Diagram view, enabling a more focused view of items they consider critical or important to their work, and facilitating in-depth process analysis.
In this topic, we will explore how to access map options and discover the full range of map customization features at your disposal.
How to Access Map Options
- Navigate to the Diagram View of any process.
- Select the ‘More Options’ (
![]() ) drop-down menu, located at the top right of the page.
) drop-down menu, located at the top right of the page. - From the drop-down, select ‘Settings’
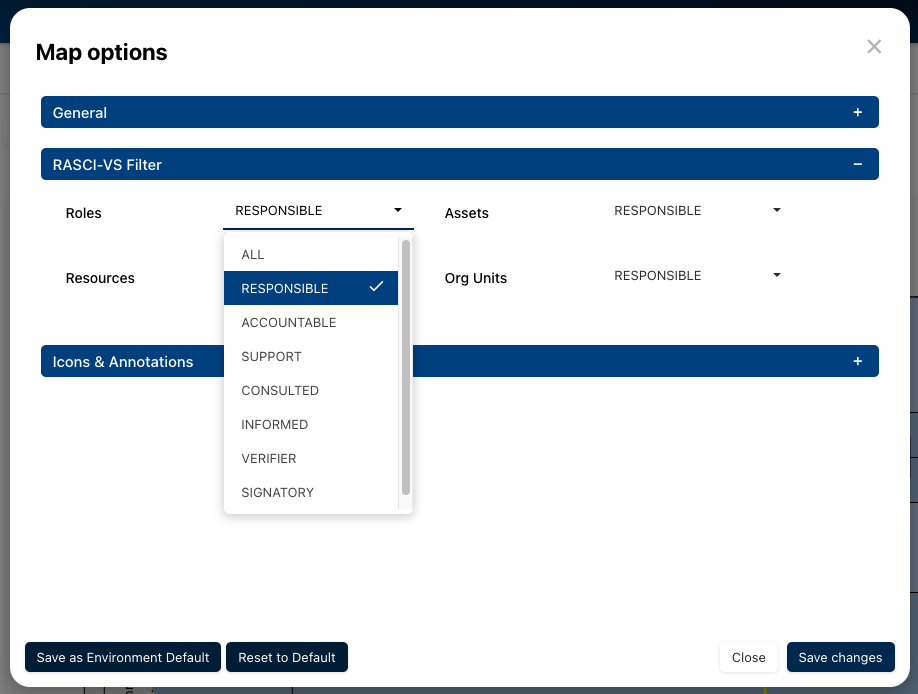
- The ‘Map Options’ pop-up will be displayed, as shown below:
 ) drop-down menu, located at the top right of the page.
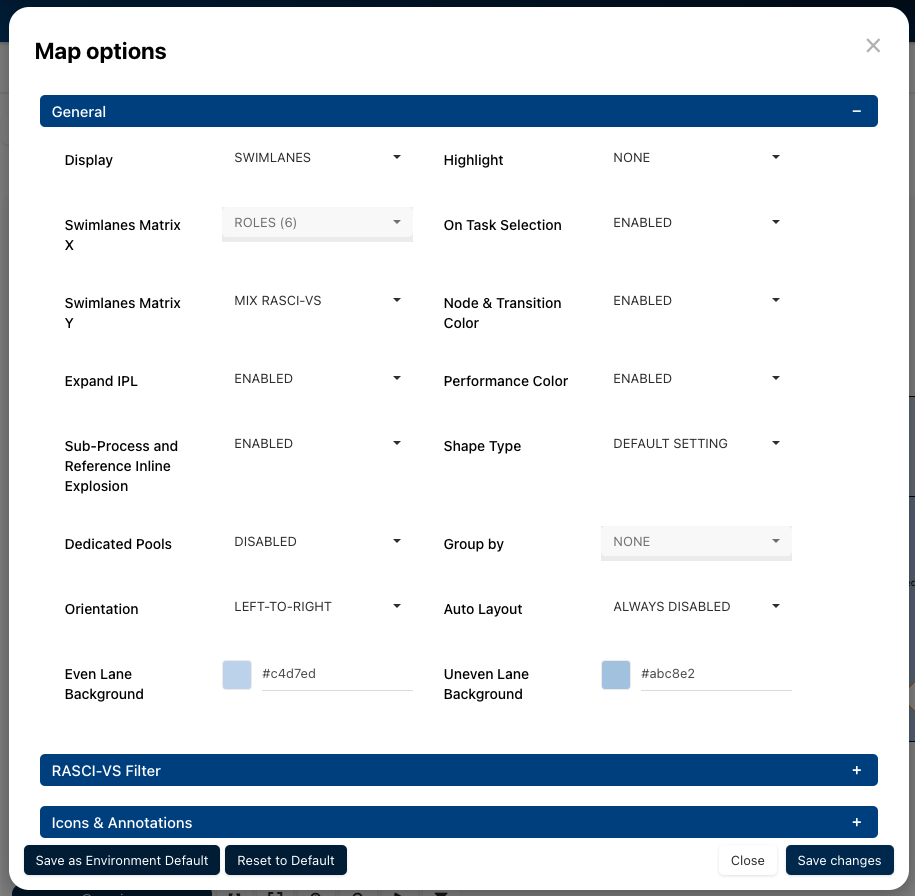
The Map Options are separated into 3 sections:
General
- Display: This option allows users to toggle between Flowchart, Swimlanes, Matrix and Saved Layout map views. This option is not commonly used as it is possible to toggle between map view within the diagram page itself.
- Swimlanes Matrix X: This option allows users to choose what will be displayed in the X-axis for Matrix diagrams. All items that are featured within a process are marked by a set of brackets with a number. The number corresponds to how many of each item is featured within the process.
- Swimlanes Matrix Y: This option allows users to choose what will be displayed in the Y-axis for Matrix diagrams. For optimized Matrix view, users should not select the same item for both axes.
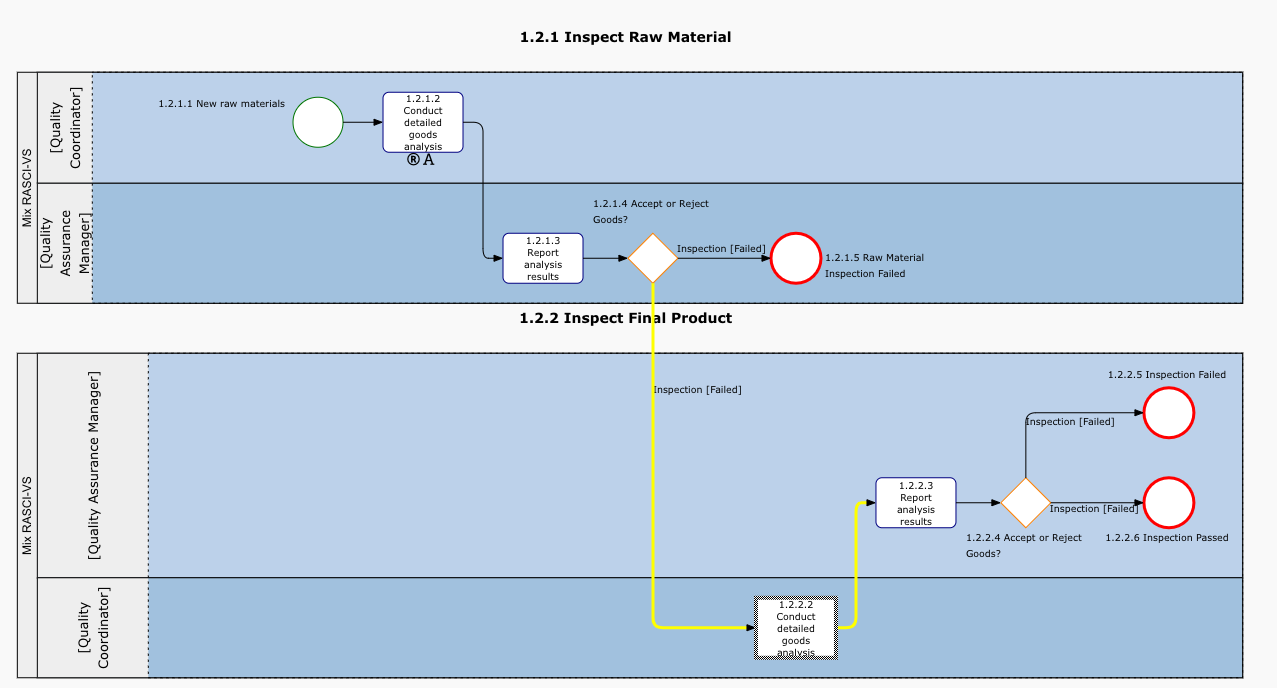
- Expand IPL: This option allows users to expand Inter-Process Links (IPLs) to view the full implication of a given process.
- If disabled, this option will redirect you to the linked process.
- If enabled, this option will expand the graph to show the current process extending into the linked process, like so:
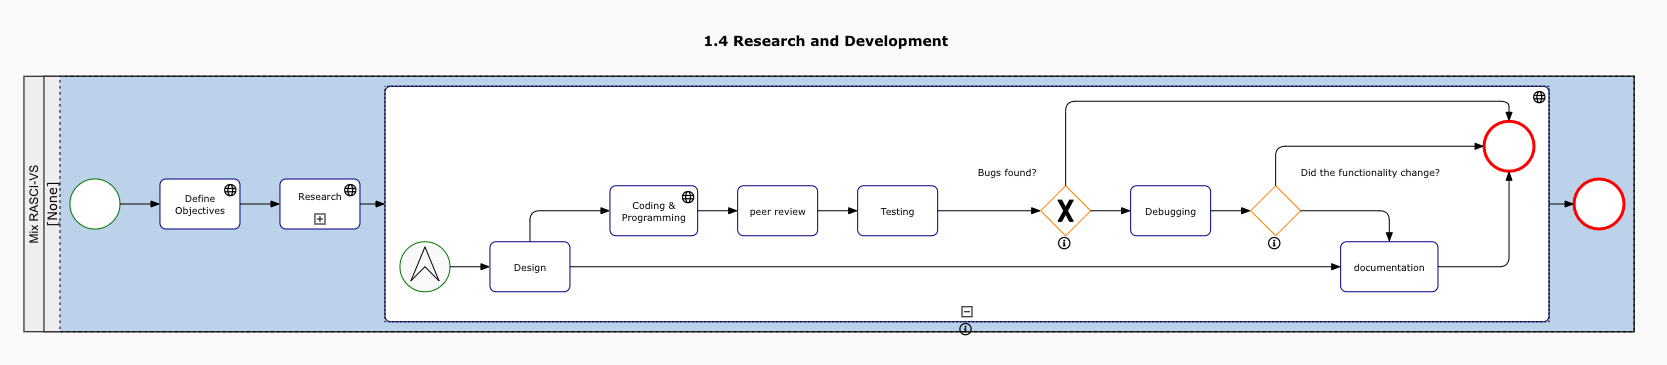
- Sub-Process and Reference Inline Explosion: This options allows users to enable sub-processes and reference expansion within a current process map, by clicking on the ‘
![]() ‘ of a subprocess, like so:
‘ of a subprocess, like so:
- Dedicated Pools: This option allows users to isolate specific roles, resources, assets and org units into separate Swimlanes.
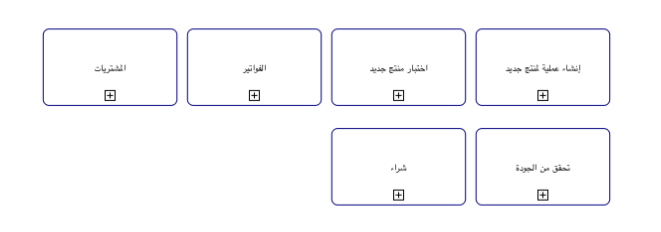
- Orientation: This option allows users that work with languages written from right to left such as Arabic, Farsi and Hebrew to clearly view and read process and process set maps.
- Highlight: This option lets you emphasize key aspects of your process. You can highlight the Critical Path, High Risk Path, Value Added tasks, your assigned tasks, and distinguish between manual and automated activities.
- Critical Path: Identifies the sequence of flow objects essential for the minimum process completion time, manually selected in the graph editor by Modelers.
- High Risk Path: Marks the path with the highest risk, manually determined within the diagram editor.
- Value Added: Highlights flow objects that contribute value to the process, manually selected in the diagram editor.
- My Tasks [ R ]: Flow objects assigned to you through a resource or role are highlighted, focusing on your responsibilities.
- Manual Vs Automated: Indicates automation levels: red for tasks requiring human input, yellow for tasks with human input assisted by a system, and green for fully automated tasks. The highlighting depends on the asset, role, resource, or org unit assignments. See the table below for RASCI-VS assignment rules:
| Color | RASCI-VS Assignment |
|---|---|
| GREEN | Asset [ R ] or/and [ Su ] |
| YELLOW | Asset [ R ] or/and [ Su ] + Role/Resource/Org Unit [ R ] |
| RED | Role/Resource/Org Unit [ R ] |
- On Task Selection: This option allows users to choose what happens when they click on a flow object on the map.
- If enabled, the input and output transitions will be highlighted.
![]()
- If description pop-up is selected, a pop-up with the description of the flow object will be displayed. The transitions will also be highlighted.
![]()
- If enabled, the input and output transitions will be highlighted.
- Node & Transition Color: If enabled, the colors that have been set on flow objects within the diagram editor will be displayed in the diagram view.
![]()
- Performance Color: If enabled, flow objects will adopt the color (Green, Yellow, or Red) of the associated performance indicator. If multiple performance indicators are associated, the adopted color will be based on the weights assigned to them.
![]()
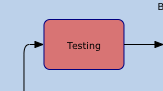
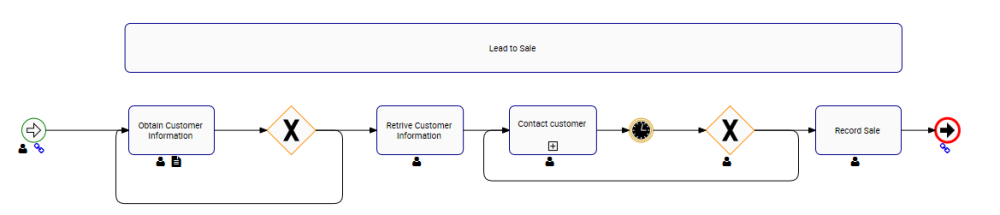
- Shape Type: The process view allows users to toggle between different process annotations. This allows users to select the process notation they are most familiar with. Users can select the following notations.
- Click here to view the different shape types.
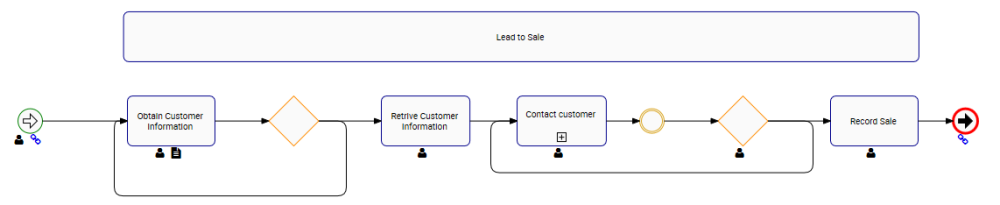
- a. BPMN 2.0 (Business Process Modeling Notation)
![]()
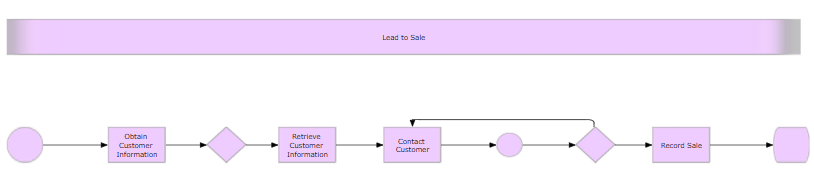
b. Simple BPMN (Business Process Modeling Notation)
![]()
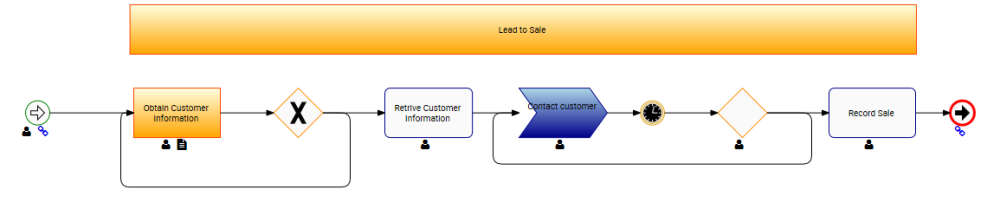
c. VSM (Value Stream Mapping)
![]()
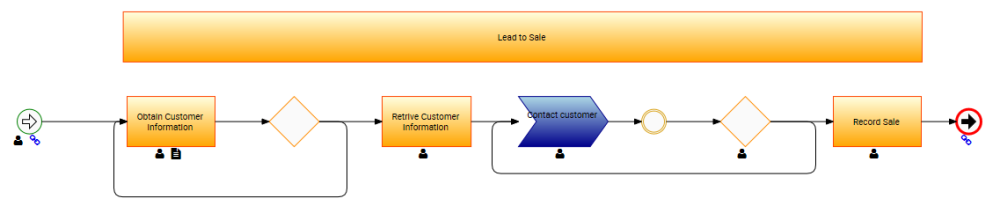
d. Default: This view allows users to mix BPMN 2.0, BPMN and VSM shapes
![]()
e. Custom: This view allows users to include custom flowchart images, provided by the System Admin, as process shape.
![]()
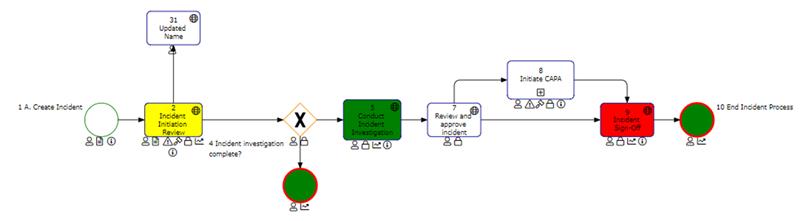
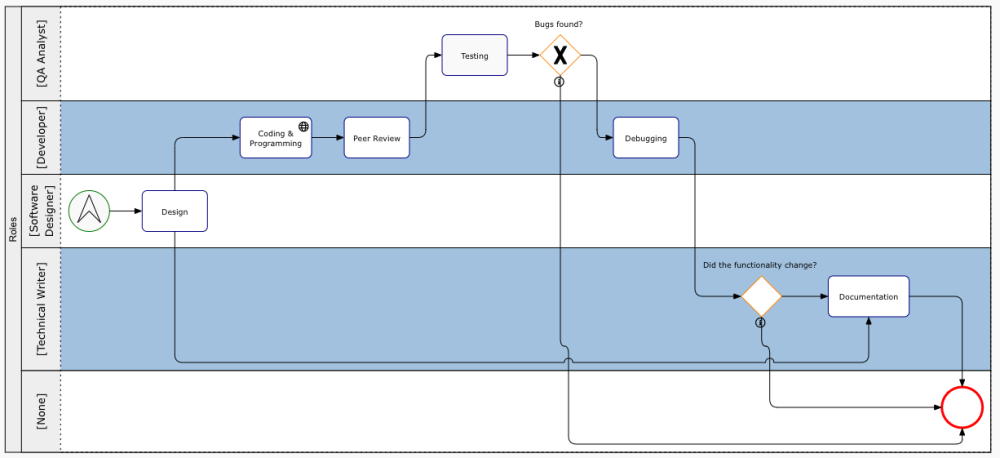
- Group By: Only available in the “Diagram” view, this section allows users to classify and group various items within process maps using predefined system categories or phases. Categories provide organizations the flexibility to customize their process maps according to industry and business-specific requirements, such as core tasks, as illustrated in the example below. Grouping by phases allows users to easily visualize the different process stages and their names, without having to switch to the “Swimlanes” view.
- Auto Layout: Auto Layout simplifies the process of generating a user-friendly layout with a single click. Users have the flexibility to enable Auto Layout in different ways:
- Always Disabled: Auto-layout is never initiated automatically. Users must manually trigger it by clicking the designated button.
- On Annotation: Auto-layout runs automatically when users expand icons into annotations or when they close annotations.
- Always Enabled: Auto-layout consistently operates automatically without user intervention.
- Even Lane Background & Uneven Lane Background: ou can easily tailor the background colors of your swimlane maps to align with your organization’s aesthetics or specific requirements. For instance, in a scenario where you have a graph with five lanes, three of them can be assigned the chosen “odd” color, while the remaining two are designated the chosen “even” color.
- Here’s how swimlane background color prioritization works:
- If a user has specified their preferred background colors, EPC will display those customized colors.
- In cases where there is no user preference, but there’s an environmental default, EPC will showcase the default colors associated with the environment.
- If neither user preferences nor environmental defaults are set, EPC will default to the traditional light-blue color scheme.
![]()
- Here’s how swimlane background color prioritization works:
RASCI-VS Filter
The RASCI-VS Filter empowers users to selectively display items on diagrams, sorted by their level of involvement. By employing the RASCI-VS filter, users gain insights into the roles, assets, resources, and organizational units that play a part in various processes.
For example, if you want to view only the Roles that are accountable for this process, select ‘Accountable’ within the ‘Roles’ drop-down.
Icons & Annotations
Customize the display of information and items on the process map to suit your needs. There are three primary options:
- Icon: Utilize visual representations of specific EPC items. Example:
![]()
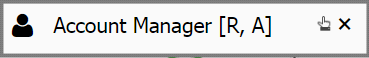
- Annotation: Expand Icons to provide detailed text descriptions. Example:
![]()
- None: Hide items from the diagram when selected.

Icons that will be displayed in the diagram if enabled:
| Icon | Item |
|---|---|
 |
Roles |
 |
Assets |
 |
Documents |
 |
Resources |
 |
Org Units |
 |
Risks |
 |
Rules |
 |
Controls |
 |
Objectives |
 |
Entities |
 |
Attributes |
 |
KCI |
 |
KPI |
 |
KRI |
 |
Materials |
 |
IPL |
 |
Categories |
 |
Annotation |
| |
Process Requirements |
| |
User Acceptance Test (UAT) |
Need more help with this?
Visit the Support Portal