
In this module, users can access visual representations of training statistics. Specifically, users can access data representing the number of trainings or training instances created per QMS application.
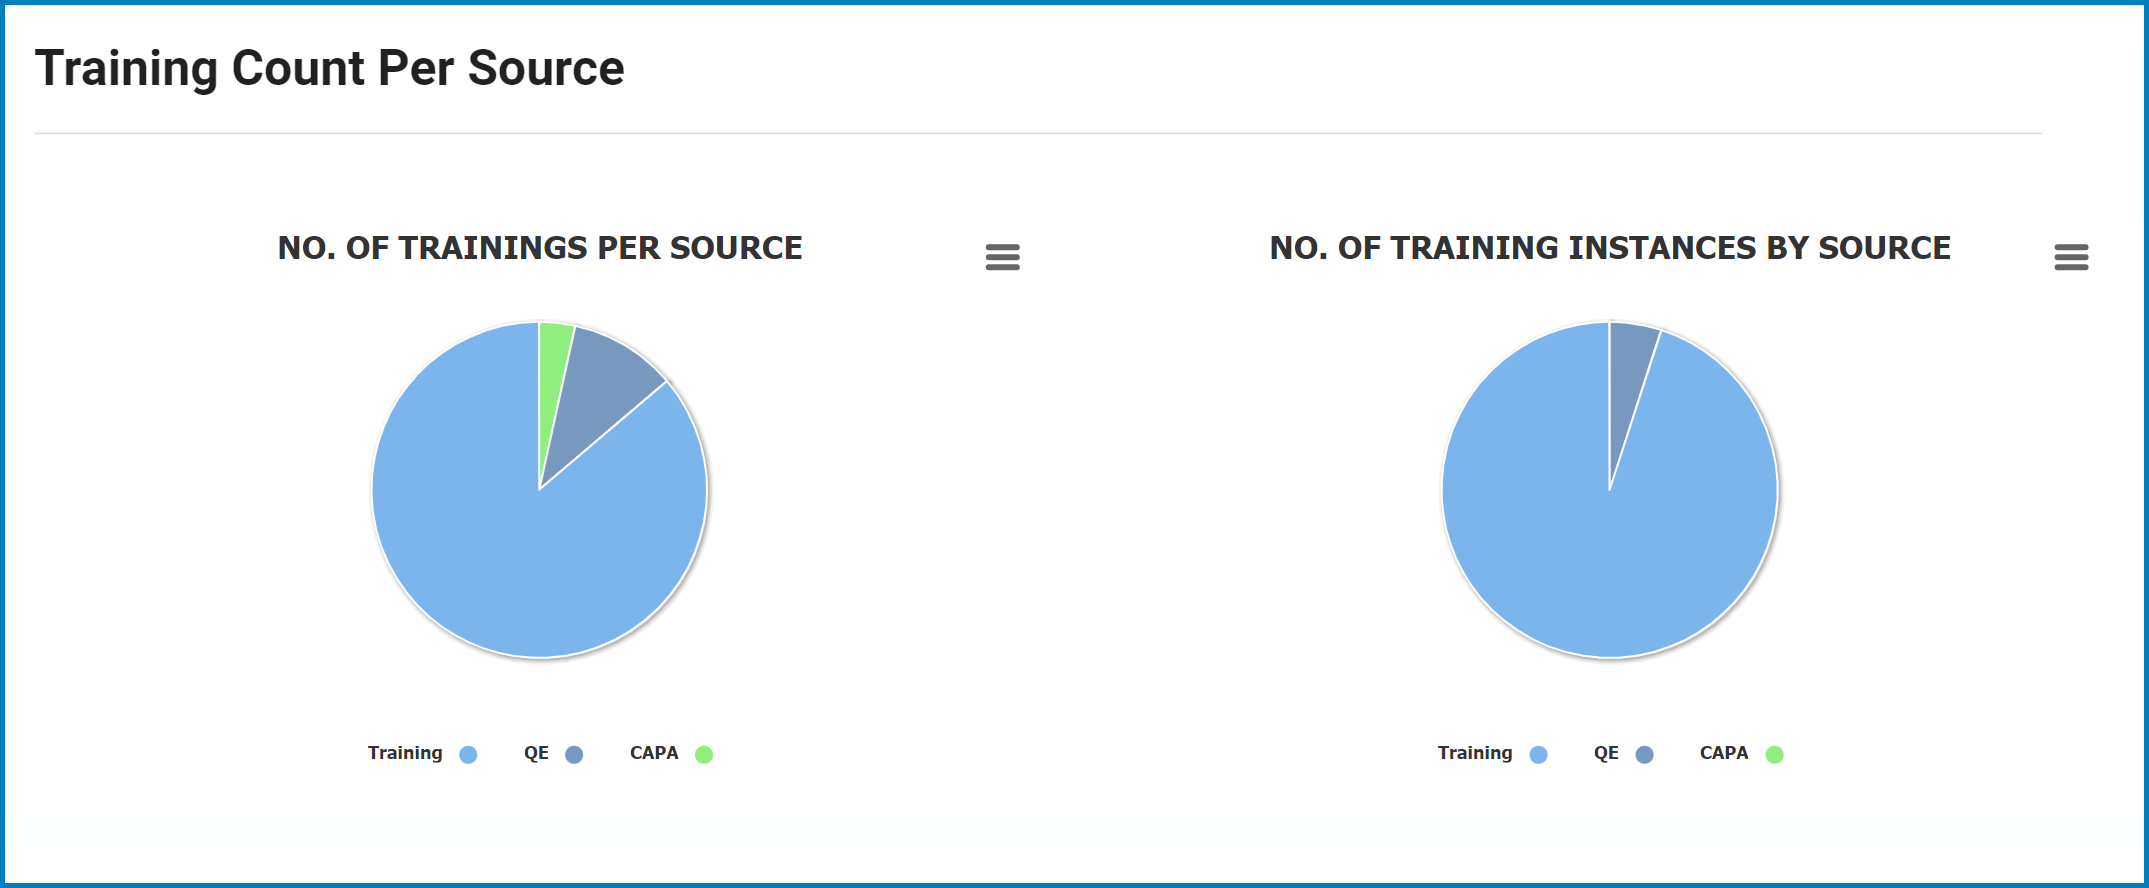
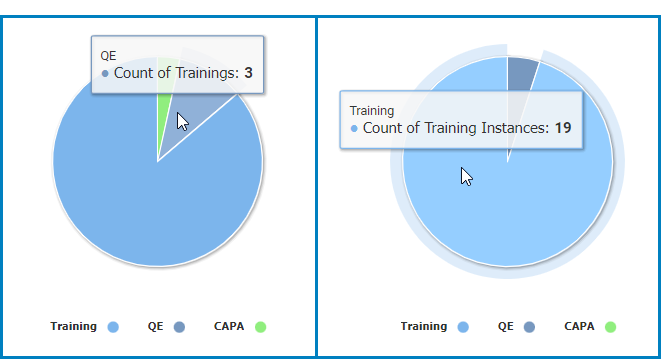
- Training Count: This is quantitative data that users can access by hovering their cursor over the different symbols in the charts. (Symbols, in this case, refers to the slices/sectors of the pie charts).
![]()
- Drilldown Reports: These are data reports that users can access by double-clicking on the different symbols in the charts. (Symbols, in this case, refers to the slices/sectors of the pie charts).
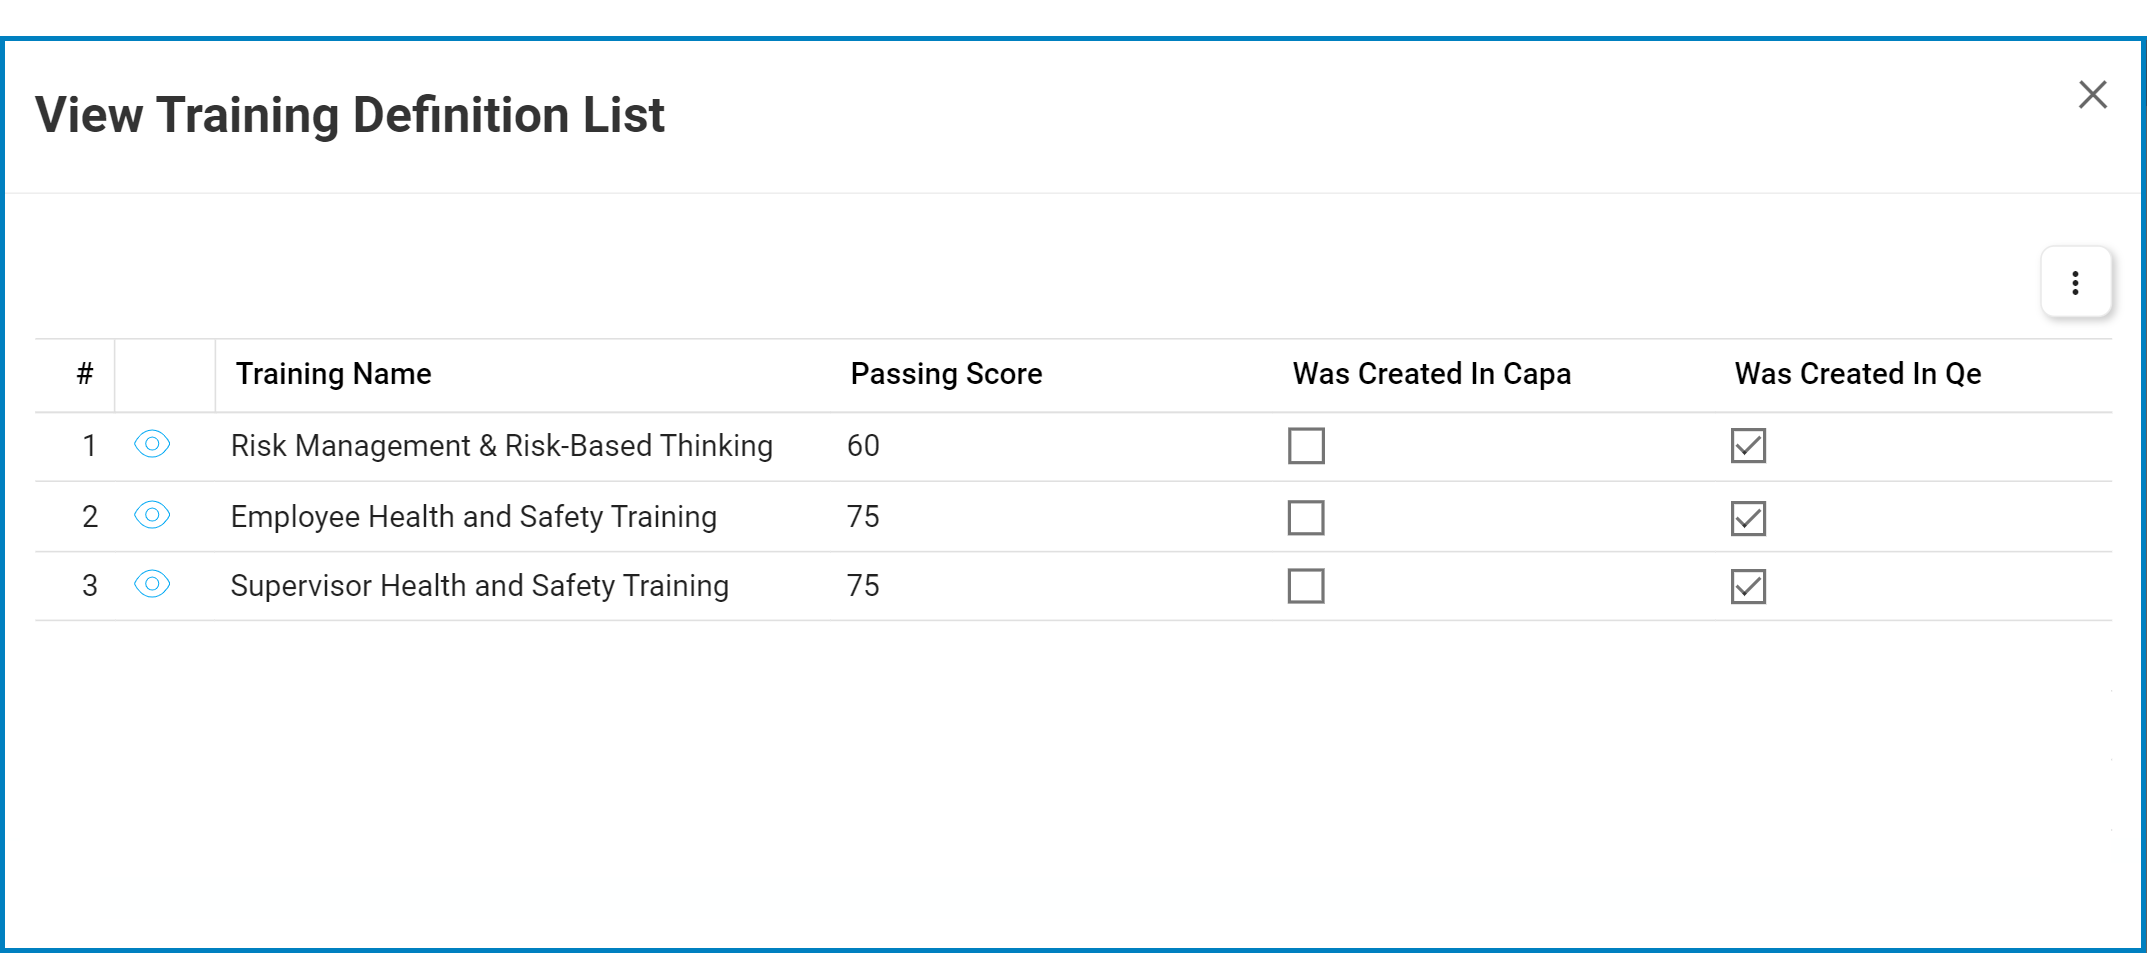
- For example, if users were to double-click on the sector representing trainings created using the QE application, a pop-up window would appear with the following form:
![]()
- View: This button allows users to view a training.
- In viewing mode, users cannot make any modifications. They are allowed, however, to access any linked EPC objects as well as access/download any available templates.
- View: This button allows users to view a training.
- For example, if users were to double-click on the sector representing trainings created using the QE application, a pop-up window would appear with the following form:
Post your comment on this topic.