
SmartMonitor SITE L within SmartView
By clicking on the device further information can be seen. The main view consists of different areas that can be divided as follows:
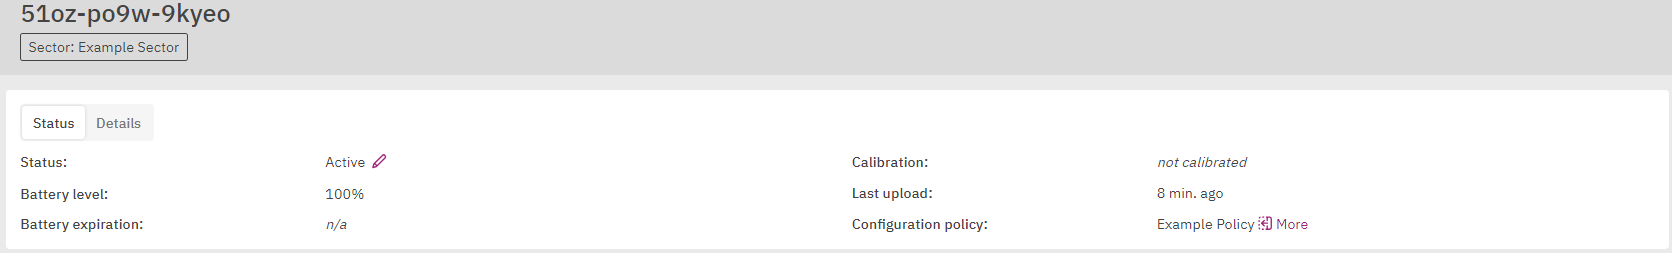
Status/details
Within this view the current status of the device is visible, this includes information like the currently applied policy as well as battery status etc. Besides that, the current status itself can be set as well as either enabled or disabled. If a device is disabled it will not stop the device from operating but it will prevent the device from being used in new shipments, sectors or TCI. While the out of service setting can be useful to mark a device that has become unusable. This may happen because the device is broken or got lost during transport. Putting the device to out of service will also try to remotely stop and wipe the device to avoid data leaking in case of a stolen device. Once a device is set to out of service it can not be reverted.
If the device itself is currently associated to a sector or a shipment the current association is visible below the serial number of the device.
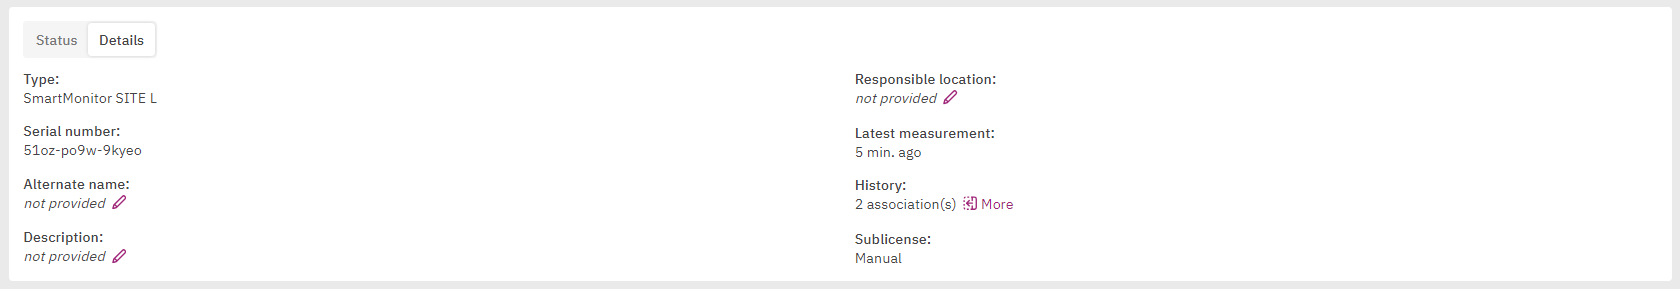
By clicking on the Details button it can be switched to a different window which will contain further information as well as an additional data field that can be customized to match personal needs. In addition within this few there is also the field Sublicense which allows to move a device from the current Sublicense to a different one.
While in the status view  can be pressed beside the policy configuration information. This will open a popup that will provide information in regard to the currently used policy.
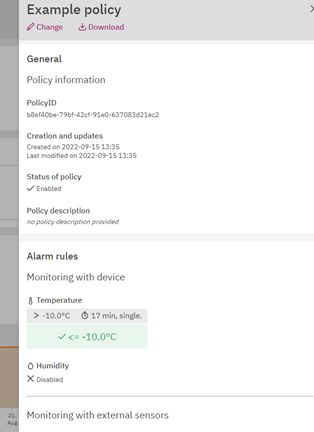
Besides watching the policy currently used by the device it is also possible to download it by pressing  on the top. In addition, a new policy can be assigned to the device by pressing
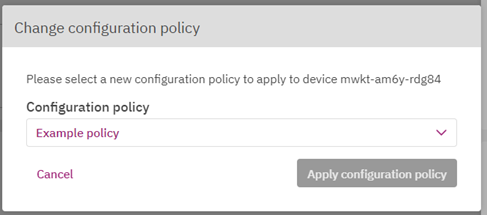
  . Then a new window will open where the new policy can be selected.
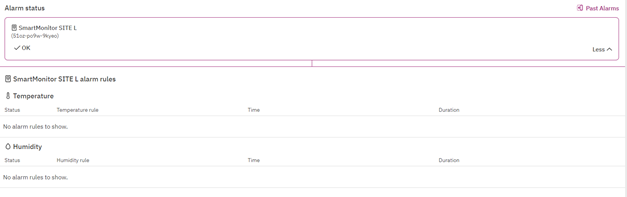
Alarm status
The current status of a device can be regard within the alarm status tab. Per default only the current status is shown. The alarm rules can be displayed by pressing the more arrow at the right side of this window.
By pressing the 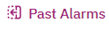 a pop up will show up that will display a history of all alarms that occurred in the past.
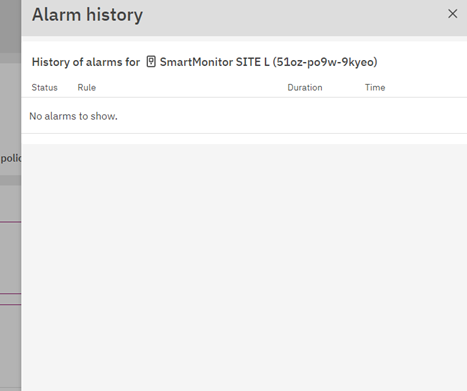
Graph
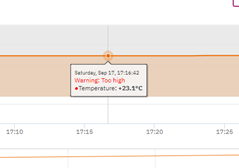
Below that the graph can be found. Each observed metric is displayed with it is own graph and each graph consists of two parts the main graph as well as a small zoomed-out overview for orientation below it.
By hovering over a specific area within the graph further more detailed information can be displayed.
In addition, the graph can also be downloaded as a png image by use of the  button beside the Graphs title.
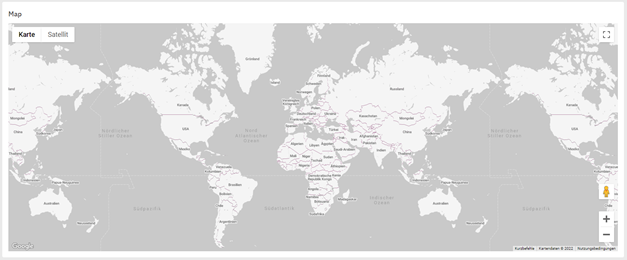
Map
The last area within this view consists of the map which will as the name suggests display a map where the device can be tracked if GPS services are activated.
Additional Functions and buttons
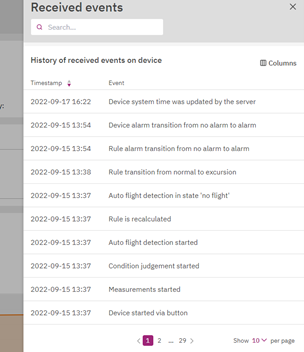
On the top right of the view by pressing the  button it’s possible to open a pop-up that will display all events that occurred. This will help to track down any manipulation and other occurrences that were observed by the device.
Post your comment on this topic.