
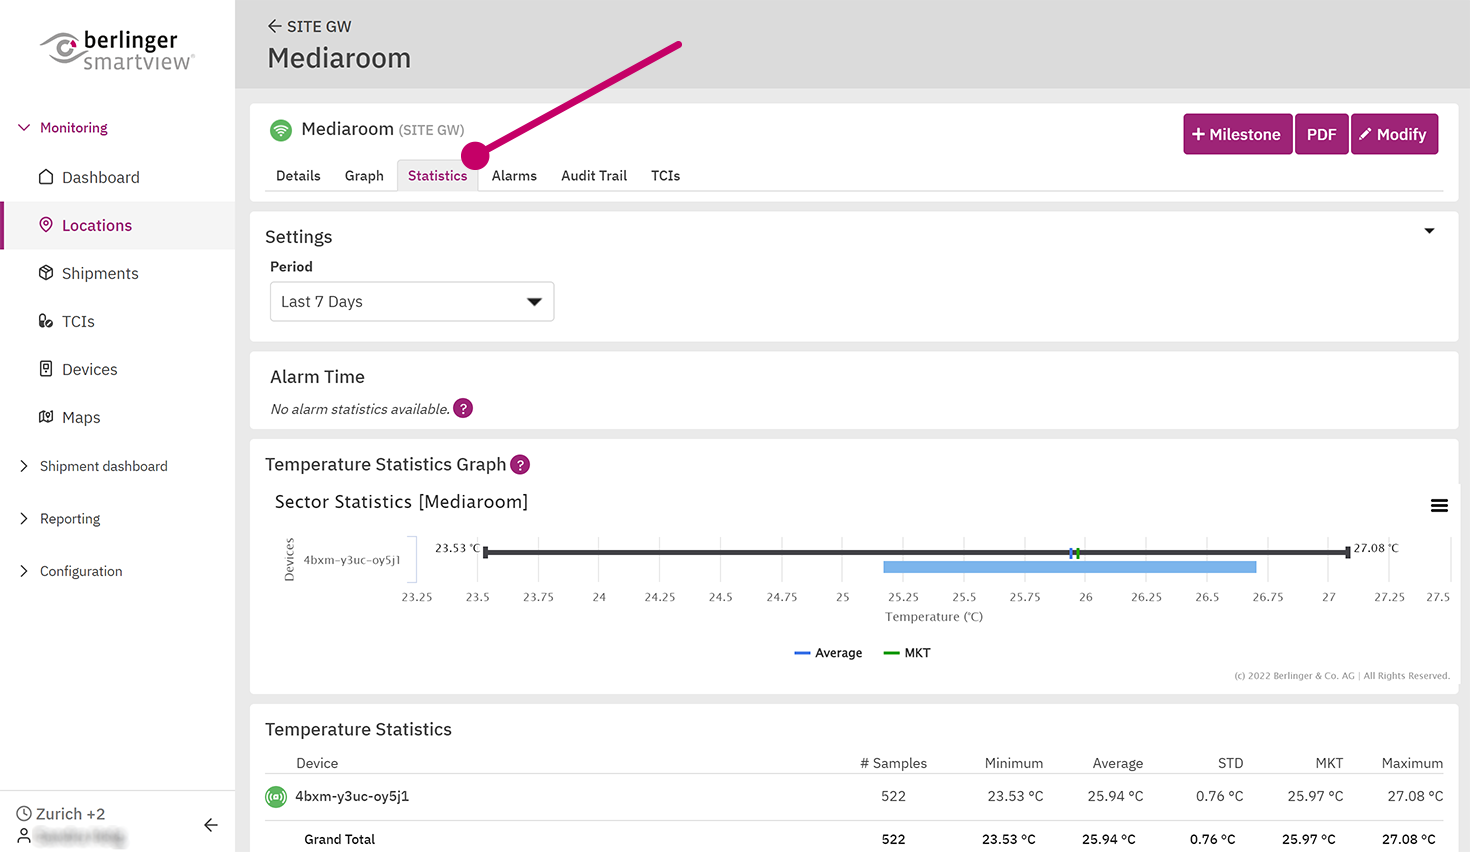
Statistics are available for temperature and humidity (if data logger is available to measure humidity). The measured data are displayed as line graphs. Additional information includes the minimum and maximum values and markings representing the average values and, for temperature values, the MKT.
- Settings
-
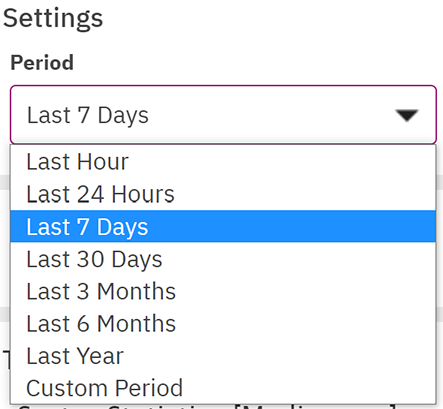
Settings
![]()
- Excursion Time
-
Excursion Time
![]()
- Sector Statistics Temperature/Humidity
-
Graphical Representation of Temperature and Humidity Statistics
The diagram provides an overview over the information based on:
- The lowest recorded value(left whisker)
- The highest record value(right whisker)
- The MKT (Mean kinetic temperature)(green mark)
- The STD (Standard deviation)(Colored bar below the line)
- The Average(blue mark)
![Sector Statistics Temperature]()
![]()
- Temperature Statistics
-
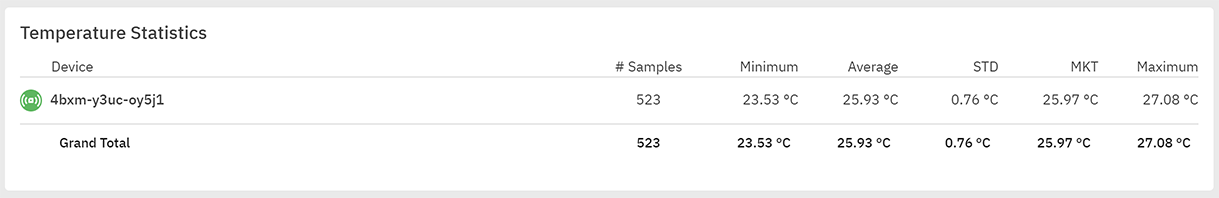
Temperature Statistics
![]()


Feedback
Copyright © 2025 Berlinger & Co. AG
—
Powered by 
Post your comment on this topic.